

In order to provide users with relevant information relating to each Qlik Sense application, it’s wise to pay attention to the options available when developing the solution. There are three levels of useful information you could share and probably should share, from within a Qlik Sense application.
These are:
– App level
– Sheet level
– Master item
App level:
The application description is the best place to store important information regarding the make-up of the application. This includes, but is not limited to, its reload schedule, target audience, reason for existence, data held within, sources systems the data is extracted from, assumptions, limitations and any nuisances the users should or might need to know. While we are covering this topic, be sure to provide a meaningful name and thumbnail (these can be generated on OmetisToolkit.com – make them memorable!) To access the app meta data click on the ellipsis/app name in the main toolbar of the app.
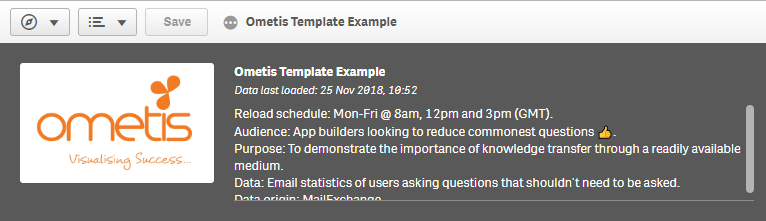
Qlik Sense automatically provides the published stream name and last reload datetime, so when a user questions the timeliness of the data, not only can they see when the app was last loaded but also when it should be next – which reduces commonly-asked questions to your internal Qlik support.
It’s interesting to note that in QlikView it was common practice to use a landing page. Personally, I’m less in favour of this approach as often the users will only need to access the information on the first few encounters of the application. If you do prefer to have a sheet dedicated for this information, I’d recommend making it the last sheet instead. That’s because users who want to view this information won’t mind navigating to it, whereas users who just want to get to the data don’t want to have to think about what sheet to select, they just want to select the first sheet and be in the data. Humans by nature are creatures of habit because it reduces the constant need to make decisions, little or large, so don’t make them think!
Sheet level:
I like using the phrase ‘every dashboard starts with a question’, so it’s no surprise that rather than just telling users what they can already see on the sheet, use the sheet description to give them questions to answer too. What question/problem led to the sheet being developed?
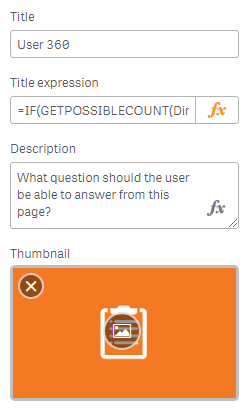
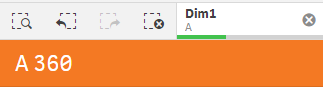
Remember to add a meaningful name as always and, if appropriate, don’t neglect a title expression. I commonly use this when developing sheets which suggest the user focuses on one dimension value at a time, such as a customer, account, or supplier view – when a user selects a value (or now you can use the always one selected value function) the title will include the value in the sheet name.
Master item:
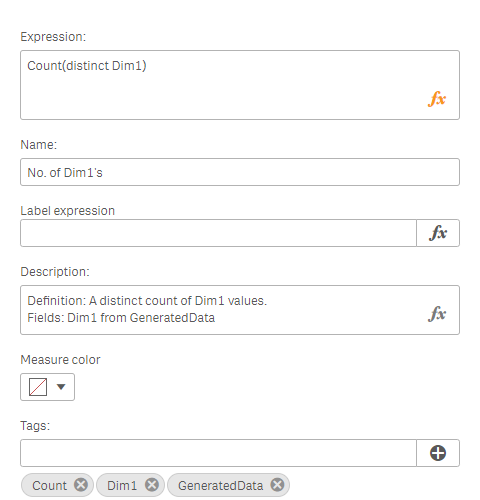
Master item meta data is probably the most important of the three levels. The meta data of a master item can promote self-service and user confidence when visualising data with expressions they haven’t created themselves. Here you should provide an accurate business definition for how to calculate the measure. Specify the fields utilised in the expression and its origins. Use tags so users can search the items with natural language – saving valuable head scratching time! Again, provide a meaningful name, using a consistent naming convention, and use label expression where suitable.
Lastly, don’t forget to ‘Show details’ in your visualisations so data consumers can understand how a calculation is made. This is accessible in the visualisation properties under the General tab.
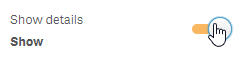
This results in an information icon displaying when the user hovers over the visualisation.
![]()
For more best practice advise be sure to follow our blog, Twitter, LinkedIn and YouTube channels.
By Chris Lofthouse


Comments