

Data brushing in Qlik Sense is the process of highlighting selected values whole still maintaining visuals of the data that does not form part of the current selections.
The concept of data brushing in Qlik Sense, and in other BI tools, is by default void. This is due to the nature of how most users interact with data. Typically, as you make a selection you filter out other, unrelated, values. However, once you get to the bottom of a hierarchy you reach the end of the line, with a single value selected, and there is no further to go.
Now, of course, the benefit of Qlik is that you can step sideways through the data or switch to an alternative hierarchy. Sometimes you want to remain focused on your current path though and it’s at this very point where data brushing offers its most value, see the example below:
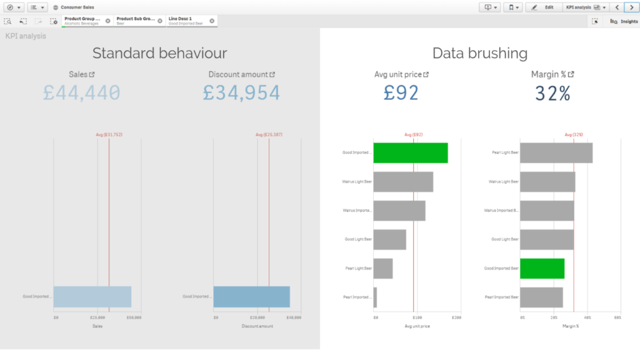
Data brushing in Qlik Sense allows analysts to view how the selected values compare against the entire data set. It’s a similar concept used within Qlik Sense Filter Panes and the Associative Engine; values never disappear, rather coloured in accordance to what is selected (green), associated (white), alternative (light grey) and lastly what’s excluded (dark grey). This means data brushing enables Qlik users to perform true comparative analysis.
You may wonder why data brushing isn’t offered out-the-box. The difficulty is the impossible task of predicting the path a user will take through the data. Compared to other business intelligence tools that use pre-defined hierarchies, which limits a user’s path to discovery like blinkers on a horse, Qlik allows users the freedom to define their own path. Having said that, I hope in the future Qlik will add an option for master drill-down dimensions to have the last dimension apply data brushing, instead of following the standard behaviour.
Let’s now look at the some of the benefits and how to apply this technique to Qlik’s well-known consumer sales demo application.
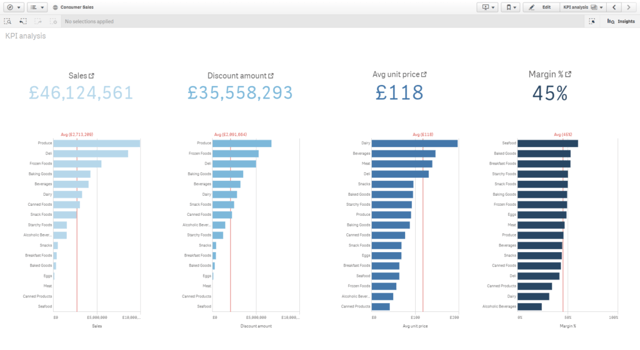
Above, I’ve altered the KPI Dashboard so we can analyse the performance of our four KPIs against the product hierarchy – enabling us to understand which products are performing consistently well across each of these KPIs. Please get in touch for a copy of the application.
You may notice that alcoholic beverages make the worst margin, but why? As I make my selections through the product hierarchy, once I reach the end of the drill-down I lose all context, as only a single value is shown:
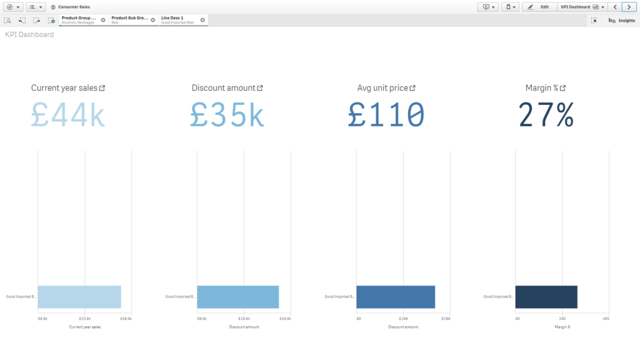
Selecting a single product will only tell us how that single value performs but it negates important questions, such as:
- How does the selected compare to other items?
- Does it follow the norm or is another factor driving the metrics?
- Where does the selected value rank in each metric?
You could argue that if you don’t select a value in the field at the bottom of the hierarchy then you could answer some of the questions. However, you’d be going against a user’s typical behaviours and you’re making them work for the answers and wasting their time. Therefore, data brushing comes in extremely useful at this stage. Unfortunately, as I previously mentioned, there is no out-the-box approach for achieving this in Qlik Sense but that doesn’t mean it’s difficult, once you know how.
There are three steps to achieve this, which I’ve run through below – there’s also a step-by-step guide video!
Data Brushing in Qlik Sense – Step One
Firstly, we want to prevent the objects from filtering on the lowest field in the drill-down (hierarchy). Here we must use a Set Expression, in this example the field for product is ‘Line Desc 1’. We will therefore add the following to our expressions:
{<[Field name]>}
For example, old expression for discount amount was:
SUM( [Discount Amount] )
New expression for discount amount:
SUM( {<[Line Desc 1]>} [Discount Amount] )
Data Brushing in Qlik Sense – Step Two
Secondly, we need to generate a list of selected values within the bottom field (Line Desc 1). For this I typically use the following and store it in a variable:
=Replace(CHR(39)&GetFieldSelections([Line Desc 1],’,’,100)&CHR(39),’,’,CHR(39)&’,’&CHR(39))
Data Brushing in Qlik Sense – Step Three
Thirdly, we need to create the colour expression to highlight the selected values. You could add a version of the following to the Colour by expression editor of the object, but I tend to recycle the code by storing it as a parametrised variable:
IF(GetSelectedCount([Line Desc 1])>0, IF(MATCH(MAXSTRING([Line Desc 1]), $(vProductSelections))>0,RGB(0, 181, 26), RGB(169, 169, 169)),RGB($1, $2, $3))
I then call the variable and pass it the RGB values of the default colour:
$(vProductColourCondition(68, 119, 170))
Now When I select a single, or multiple, values it highlights them accordingly:
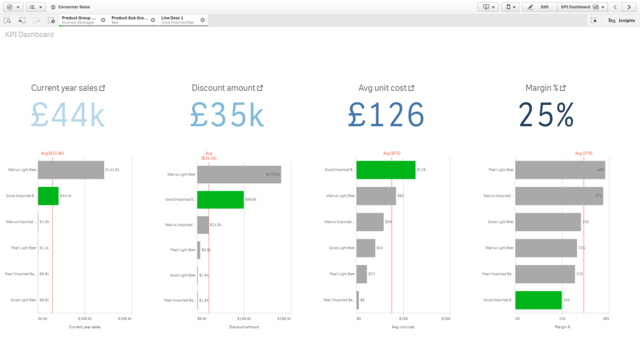
With data brushing applied, we can start to understand the meaning behind the numbers. The product ‘Good imported beer’ had the second weakest margin, and despite achieving the second largest sales it was still less than a third of the sales of ‘Walrus light beer’. Interestingly though, ‘Good imported beer’ was discounted at a similar rate to ‘Walrus light beer’, in spite of it costing considerably more. With this information we could take action to prevent sales people from making unacceptable levels of discount on the product or reconsider stocking the item altogether.
I think you will agree to achieve this level of comparison and understanding without brushing would take considerably longer and would require many more clicks!
Data Brushing in Qlik Sense – Our Guide to Unlocking its Power
For more information on data brushing or how you could unlock the full potential of Qlik Sense, please get in touch with us – either directly or through our social channels.
You can stay up-to-date with all the latest Qlik news, tips and tricks by following us on LinkedIn or Twitter and subscribing to our YouTube channel.
Topic: Data analytics


Comments