

The pivot table is a flexible option when you want to analyse your data from different perspectives. The table allows you to reorganise multiple dimensions and measures in rows and columns to explore subtotals of different groupings, just by drag and drop. But when you want to calculate a measure by retrieving values from other columns or rows, you need to consider using the inter-record functions. These functions are useful when you want to return other values in your data set for comparison or aggregation. However, it’s not always obvious which function to use. This post explores some useful pivot table functions and when to use them.
Pivot table functions overview
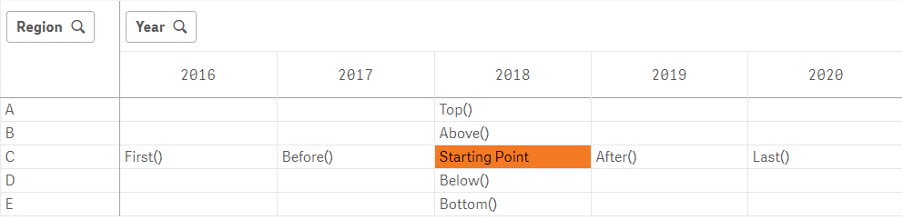
The figure below summarises some common pivot table functions and what they do when you apply them to a given field. In this example, the centre field “Starting Point” will serve as our given field and be used as the starting point for each function. The figure then shows where in the table the data will be retrieved from depending on which function is applied.
Putting pivot table functions into practice
Let’s put the functions into practice to see what they do more specifically. Because this post focuses on the pivot table chart, the examples below are column functions on the horizontal level. Each column function has an equivalent row function on the vertical level and is mentioned in each example. However, one difference to bear in mind is that the row functions can also be used in other chart types whereas the column functions are limited to the pivot table only.
Before()
Just like it sounds, this function returns the data from the column before the current column within a row segment. The equivalent row function is Above(). Please note that the first column in the table will return a null value since there is no column before the first one. To overcome this, you can use an ALT statement to always set a numerical value such as zero (see the example below).
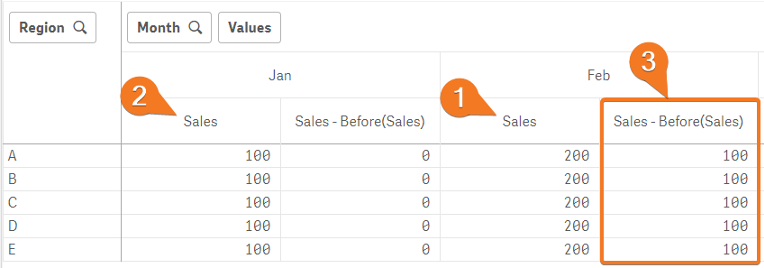
The before function is a good option when you want to compare a previous month’s data with the current month. In the below example, each month’s sales (1) is subtracted by previous month’s sales (2) and returns the difference (3). The following expression is used in the example:
ALT(Sum(Sales)-Before(Sum(Sales)),0)
To get a more in-depth example of the before() function, please visit this earlier blog post:
https://www.ometis.co.uk/this-week-last-week-in-qlik-tables/
After()
This function returns the data from the column after the current column within a row segment. The equivalent row function is Below(). Again, please note that the last column in the table will return a null value since there is no column after the last one.
The after function is a good option when you have a descending sort order in your pivot table. For example, you need to retrieve the previous month data but you want to display the latest month as the first column in your table. The after function in this case does the exact same thing as the before function in the previous example, but is used in a reverse column sort order.
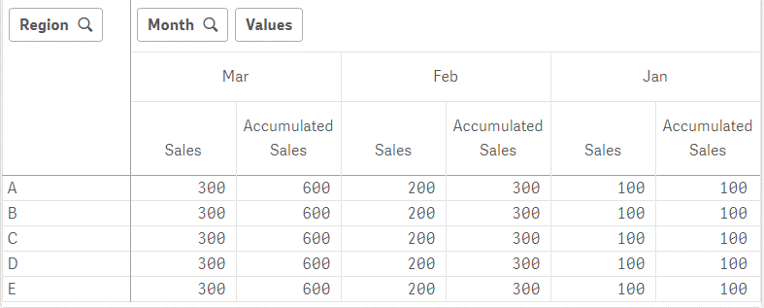
In the below example each month’s sales is accumulated with the previous months’ sales and presented in a descending order. The following expression is used in the example:
Rangesum(After(Sum(Sales),0,NoOfColumns()))
First(), Last(), Top() and Bottom()
These functions can be used to return the first or last values from a row or column segment. Example of a use case is when you have several data entries for the same identifier, for example several timestamps or status changes on a transaction, but you only want to sort out and display the latest (or oldest) value. Descriptions of each function can be found below:
- First() returns the data from the first column of the current row segment.
- Last() returns the data from the last column of the current row segment.
- Top() evaluates an expression at the first (top) row of a column segment in a table.
- Bottom() evaluates an expression at the last (bottom) row of a column segment in a table.
More pivot table functions
As we have learned in this post, you can pretty much retrieve and return any cell value in a pivot table to your current measure. In this post we have focused on relative functions that may return different values depending on how the table is structured. To return the same values regardless of where the measure is being used, you can use absolute column functions such as ColumnNo() or NoOfColumns() to determine an absolute column number. We recommend that you visit Qlik’s Help site to learn more about the other inter-record functions:
I’d love to hear if there are any other useful functions that you use frequently in your tables?
By Mats Severin


Comments