

With our usual technical blogger extraordinaire, Christopher Lofthouse, off on his summer break, Alex Walker steps into his considerable shoes to give us a quick run us through the latest and greatest features in the Qlik Sense September 2018 Technical Preview.
Once again, we have a feature-packed release from Qlik, making it hard to pick my favourites, so I’ll just run through them in a descending scale of how excited I am about them. Of course, this comes with the usual warning that the final release may include all these features, or they may be somewhat or totally different to how they’re represented here!
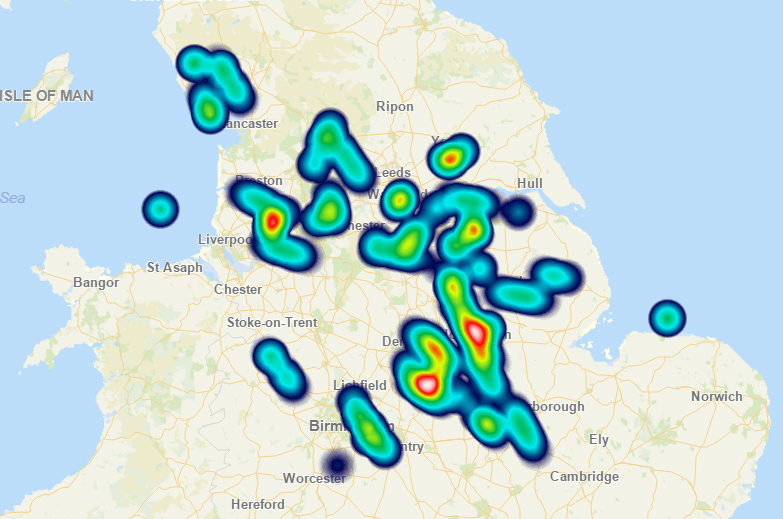
1. Density Layer in Map
I love the new map object that’s been developing rapidly over this year’s Qlik Sense releases – adding multiple layers & layer types. This release pretty much completes the picture for me and fills the last significant gap with the GeoAnalytics extension map object with the introduction of the “Density” layer (known by most people as heatmap). This summarises map data automatically for you, showing the density of points. It’s a big help when you have a lot of points you need to show but don’t want to build your own methods for grouping / summarising them.
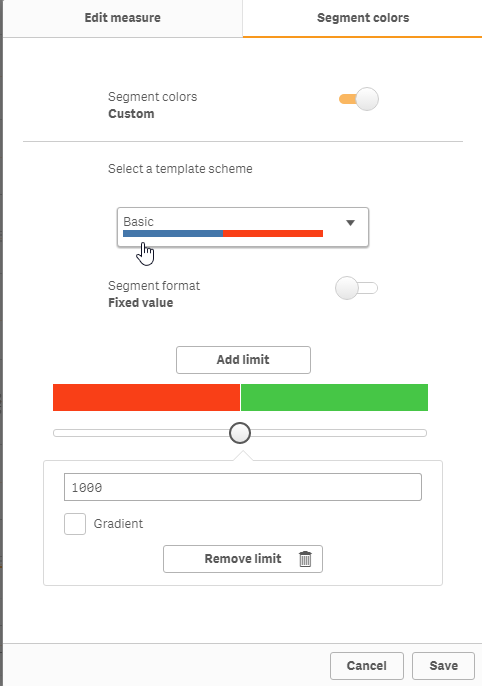
2. Segment Colours for Master Measures
Master Measures have come a fair way since the early releases of Qlik Sense and this is another step to increase their usefulness – allowing developers to define centrally-managed colour schemes for measures. They can be based on absolute values or as a percentage of the total and can be basic colours or colour gradients. One thing to watch is that the percentage-based limits are within current selections, so the same value may change colours as you change your selections. I’ve been waiting for this functionality for a while and it’s great to see it in place, but I think there is still room for improvement.
Firstly, I want to be able to use it in tables – for now it appears to only work with KPIs and graphical charts. The obvious use case here is making negative numbers red in a table – this is not possible using master measures at the moment, you have to write a text colour expression yourself.
Secondly, applying it is a little buried and doesn’t work with Chart Suggestions (renamed from “Chart Assistance” in this release). For a KPI you go to Color and enable Conditional Colors. For a bar chart you go to Colors and Legend, select Custom Colors, then “By Measure” and make sure your master measure is selected as well as Library Colors enabled. For me, these should be the defaults if the master measure has this enabled – maybe that will be resolved in the final release – I hope so.
3. Default bookmarks
This is probably one of the most often requested features from our customers and, while there are already workarounds for it, it’s nice to see it being built in following this feedback. To use this, you just create a bookmark, right click on it and set as the default – this appears to be done at development stage and is the same for everyone, not user-specific. Then, when anyone opens the app that bookmark will be selected automatically. Note that this only applies the field selections, not the sheet selections – users are still presented with the sheet summary when they first open an app. Also worth noting is that bookmarks can’t be dynamic – so you can’t have one that selects Date=today(), you’d have to have something in your calendar so you could select DateDescription=’Today’ or similar.
![]()
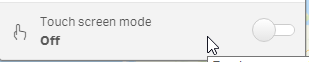
4. Toggle Touch screen mode
I know my colleagues with touch screen laptops would probably rank this #1 but I don’t have one, so it comes lower down my list. It’s a simple thing now to disable the touch screen mode simply with a toggle in the front end. Touch screen mode gives you a different experience when you right click and no script suggestions in the data load editor, amongst other things – great on an actual tablet but frustrating if you happen to be on a laptop with a touch screen and want the laptop experience. I’m yet to play extensively with this to see if your setting is per-app, per-server or per-session.
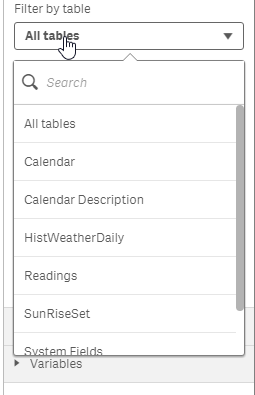
5. Table/Field search in expressions
If you have an app with lots of tables and fields, this could previously make the drop-down selections in the expression editor pretty much useless. In this release there’s built-in search capabilities – yay!
6. Fixed sheet resolutions
My initial reaction to this one was one of going back in time – why would any one want to re-introduce one of the biggest limitations of QlikView into Qlik Sense with fixed screen sizes?! Then I realised that there are probably totally valid use cases where you need a consistent end-user experience and therefore need a fixed resolution. Even just for testing purposes this might be useful.
In the release notes this comes under “Advanced Authoring” so it’s a step towards allowing people to create a variety of experiences of the data, even within one app – some sheets can be fixed, some responsive. This would work well with NPrinting for instance if you could set a sheet to the size and resolution for an A4 page and then lay things out precisely in Qlik Sense rather than having to do that in NPrinting. Of course, NPrinting would need to work well with this, but even in the first instance, it might allow for better designing of objects for use in NPrinting as that uses a fixed resolution.
Summary
All of these are steps in very much the right direction for Qlik – balancing introducing new features with making sure the interface stays as simple to understand and use as possible, drawing on the community feedback as well as the expertise of the companies they’ve acquired over time. Can’t wait to start getting it rolled out to customers’ environments next month!
By Alex Walker

Comments