

Earlier this year, I wrote about the Evolution of Qlik Sense and we saw some fantastic results. For example, the time to insights had reduced by 20% between the November 2017 and June 2018 releases. Using the same test scenario, I think it’s only fair to compare Qlik’s legacy product, QlikView. Firstly though, let me provide a quick overview and positioning of the two products.
QlikView is an interactive analytics application, requiring technical expertise to build dashboards locally, which can later be deployed to the QlikView Sever.
Qlik Sense embraces all users, from technical experts to the least-technical business-users. Its analytical platform is built on the latest web technologies and, thanks to its responsive user interface, users can perform data preparation, visualisation and exploration from any browser, on any device. The open APIs provide technical experts with all the flexibility to build custom applications, extensions and embed analytics into third-party applications.
It’s worth noting here, I am 100% biased towards Qlik Sense, and who can blame me when even Qlik openly recommend Qlik Sense for all new customers and/or use cases.
I often compare QlikView to Android and Qlik Sense to the Apple’s IOS. On one side (Android) you have customisation, but with that you an overwhelming number of menus and properties, a clunky interface and not all screen resolutions are supported. On the other side, with Apple you have less customisation but a responsive layout, a consistent look and feel and a governed environment.
Let’s continue look at the out-the-box use cases for each of the products, and thus ignoring the ‘Reporting’ use-case for this blog. Below, you can see Qlik Sense benefits from four main use-cases to QlikView’s one:
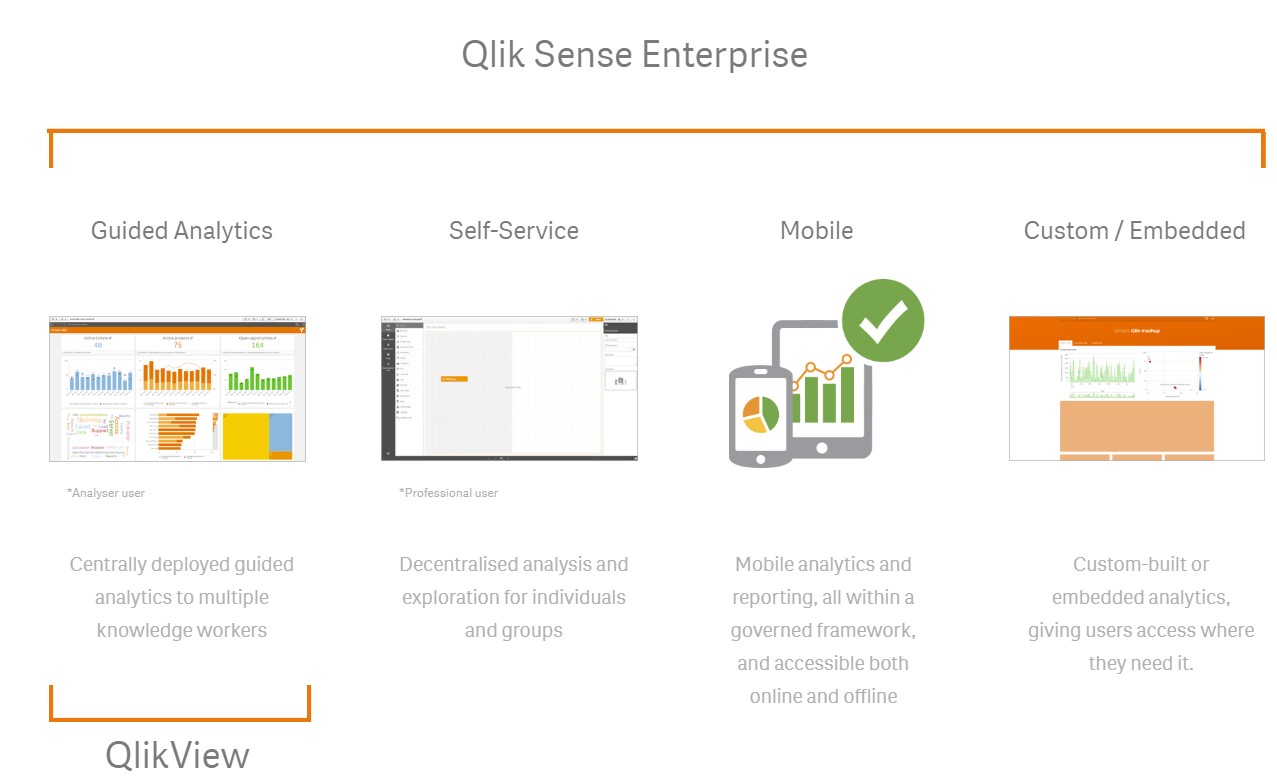
There is no denying that QlikView is a great data discovery tool for guided analytics, and it’s ultimately what turned me into a Qlik enthusiast. However, let’s be honest, the user-interface is looking rather outdated. Let’s not forget, QlikView was built in an age where developers had free-reign over the design of the interface, before companies like Apple changed the paradigm of product design.
Qlik Sense, on the other hand, has best practice visualisation baked into the platform. This means, while Qlik Sense can still be used for guided analytics, it can also be used for true self-service visualisation. With its responsive layout, you also won’t need to worry about screen resolution, simply build once and it will automatically scale and adjust to the layout based on the client’s resolution – making it mobile friendly.
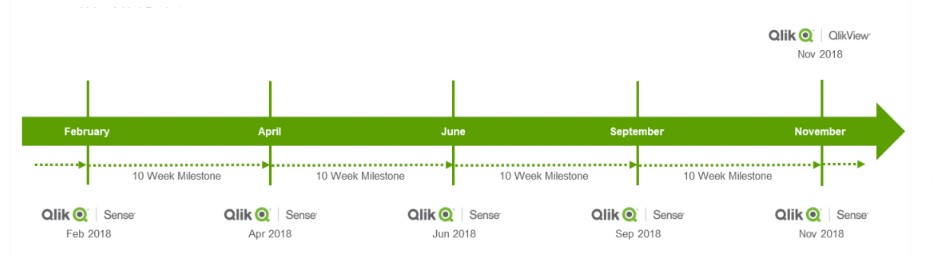
Furthermore, if we look at the release cadence for both products, it’s clear to see the investment and future direction of the company is aligned mainly with Qlik Sense – with five releases per year. QlikView has a single annual release – with far less innovation included.
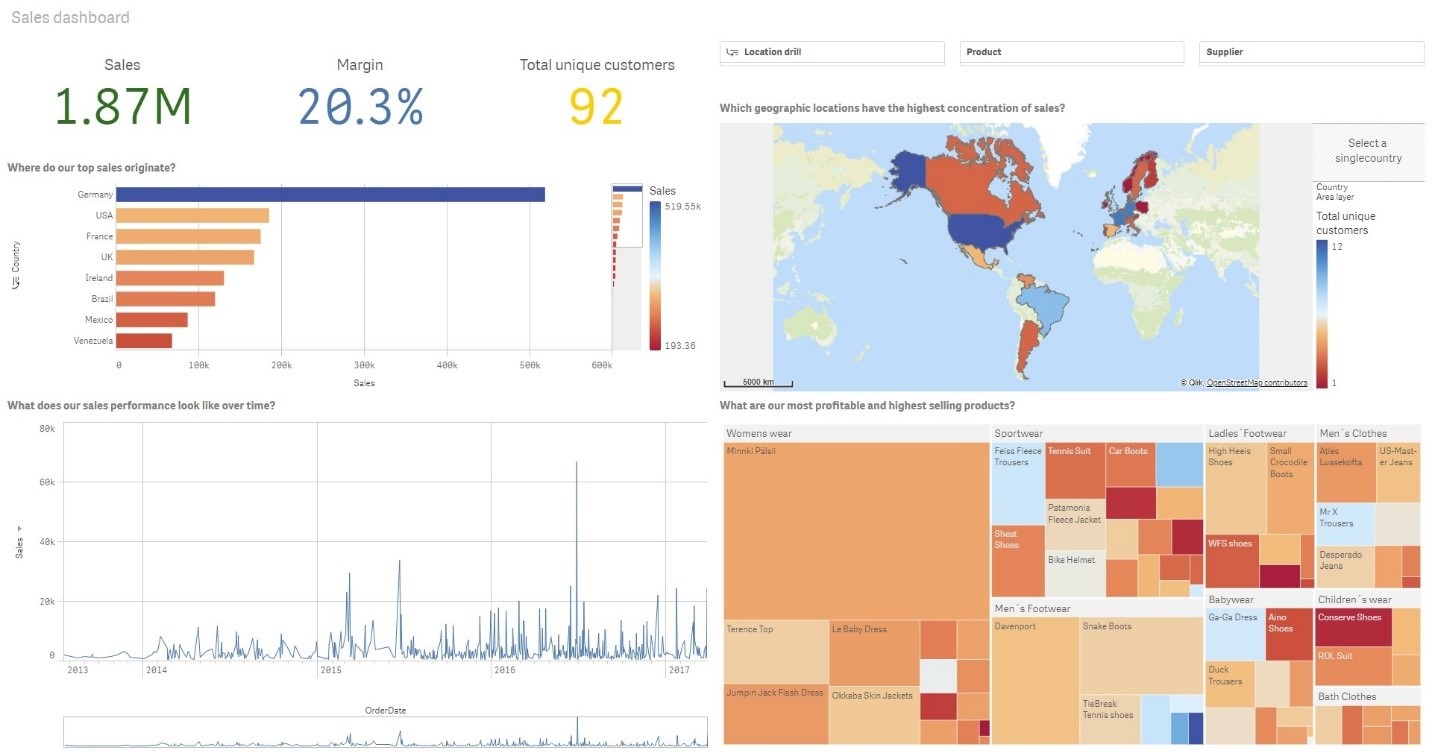
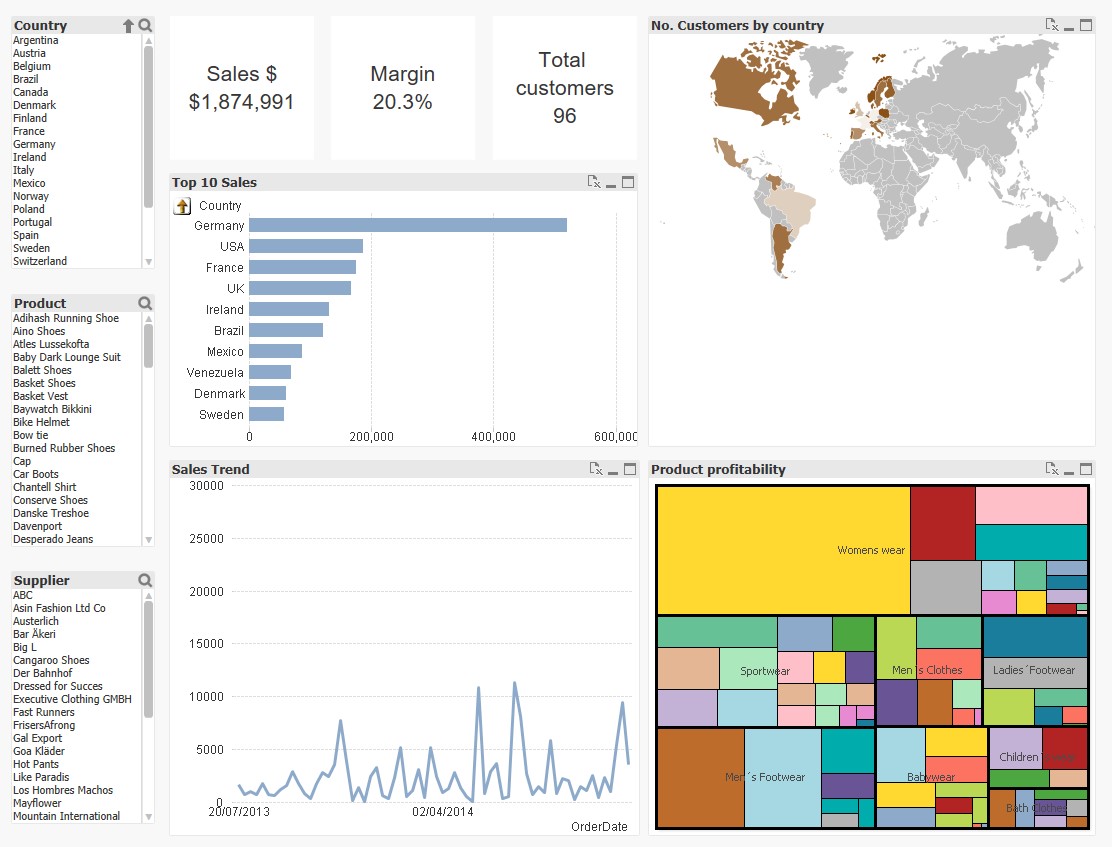
Let’s focus back on the test scenario. I will be using the Qlik Sense Tour 2018 workshop materials that I used previously. The goal is to reproduce the following dashboard, as closely as possible and in the shortest time.
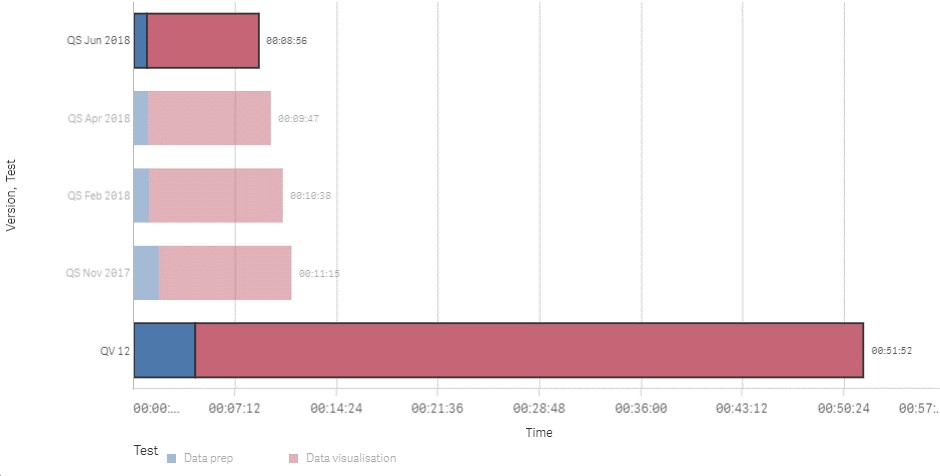
Focusing on time-to-insights, we can see below that the total time taken to perform the tests, data prep (the loading and associating data) and data visualisation, took five times longer in QlikView compared to Qlik Sense June 2018.
Some of the time difference can be explained in the data preparation. Firstly, there is no means to preview an association in QlikView, let alone recommend associations on the user’s behalf like in Qlik Sense. Secondly, it’s not possible to import multiple tables/Excel worksheets, using wizard, in batch. Instead you have to walk-through the wizard multiple times, which can only be described as clunky. The syntax highlighting is less intuitive also. Therefore, despite both products sharing the same QIX engine, the process for loading data can be far timelier in QlikView.
It’s worth mentioning that after the initial LOAD scripts are imported into the Script editor, performing more advanced scripting would see marginal differences in either product. However, if it’s feasible to use Qlik Sense’s Data Manager, it’s visual data preparation tool, even the most proficient Qlik expert would see development cycles reduce. This is because, as well as writing the script on the user’s behalf, it also implements scripting best practices and provides a preview of inline transformations, without requiring a data reload.
Lastly, I also had to import an extra data source in QlikView to display the data in a map extension. However, in Qlik Sense, there are on-the-fly geo-coding capabilities built in, so it doesn’t rely on developers loading their own set of shape files.
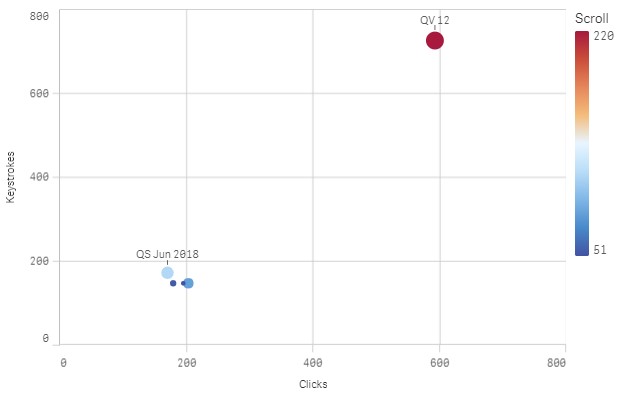
As well as time, when looking at the data visualisation test, it’s hard to forget the amount of clicking I had to do:
The greatest difference between QlikView and Qlik Sense is in the creation of data visualisations. QlikView is menu-driven, with every option you could want but takes time to get the most basic visualisations setup into an acceptable and consistent format. Qlik Sense is field driven, with the Cognitive Engine assisting users to build visually appealing charts within a couple of clicks. The Cognitive Engine removes the burden of choosing the right visualisation, but still gives the user the ability to override its initial choice with previews of the other available chart types just a click away– this helps the user ‘fail fast’ without failing at all.
Other factors that contributed to this result were the absence of map and KPI objects in QlikView. This means developers will have to add a map extension and these can only be utilised and configured in the web view and having to compromise with the text object respectfully. Other things Qlik Sense manages, without input from the end-user include:
– Responsive layout. In QlikView, this is one of the most important design considerations and can require time and meetings to discuss what is most appropriate.
– Auto-saving. This is a property you must configure in QlikView.
– Script logs can still be accessed after closing the reload progress window in Qlik Sense. However, it’s another property in QlikView that needs to be enabled. Also, with QlikView the log file is stored externally to the app– clunky!
– Snap to grid – In QlikView, you will need to enable the Design Grid property.
– Master items. These do not exist in QlikView, but you do have Variables. Unfortunately, these again are a clunky method for reusing expressions. This is because they are not drag and drop like master items. Variables have a purpose, like in Qlik Sense, but promoting self-service visualisation is not one of them.
– Even things like Alternate Values are disabled by default in QlikView. Alternative values are the light grey values in Qlik Sense or yellow values in QlikView.
As you may have gathered, QlikView is very customisable but you’ll spend a lot of time configuring the endless properties to suit your needs. Of course, once you have created an application/object you can copy it, which saves you from starting from scratch each time. However, with Qlik Sense it’s more plug and play – fewer options and fewer menus to navigate through. Therefore, you will see a quicker return on investment and it keeps the user focused on what matters – the data, and not menial properties that have no impact on the output.
Speaking of output, let’s see the QlikView equivalent, and remember not to judge me as this had to be replicated as quickly as possible:
While QlikView benefits from the Associative Engine, which instantly makes it superior to any query-based tool on the market. I spent an extra 39 minutes and 30 seconds, I performed an additional 358 clicks and hit a further 457 keystrokes and the output is not in the same league as Qlik Sense. It screams Windows 95 but we’re in 2018!
To conclude, QlikView’s greatest strength is also it’s biggest weakness. Yes, it has a property for everything, but should it? I have come across many poorly designed QlikView dashboards, and others which would be a nightmare to maintain due to properties like conditional show. Qlik Sense provides a governed environment, from standardising measure expressions with Master Measures through to recommended visualisations. For this reason, Qlik Sense prevents users from making poor design choices, but do not describe it as limiting – if you really want to display a pie chart, it will let you, and it won’t judge you for it.
So, if you have QlikView, why not take advantage of the new dual-licence which entitles existing QlikView customers to the equivalent licences in Qlik Sense with a small uplift your maintenance. This is a fantastic way to gain access to all the benefits of Qlik Sense without having to migrate overnight. If you think that could apply to you, why not get in touch to find out more?
By Christopher Lofthouse


Comments