

Level 1 – The answer to the question.
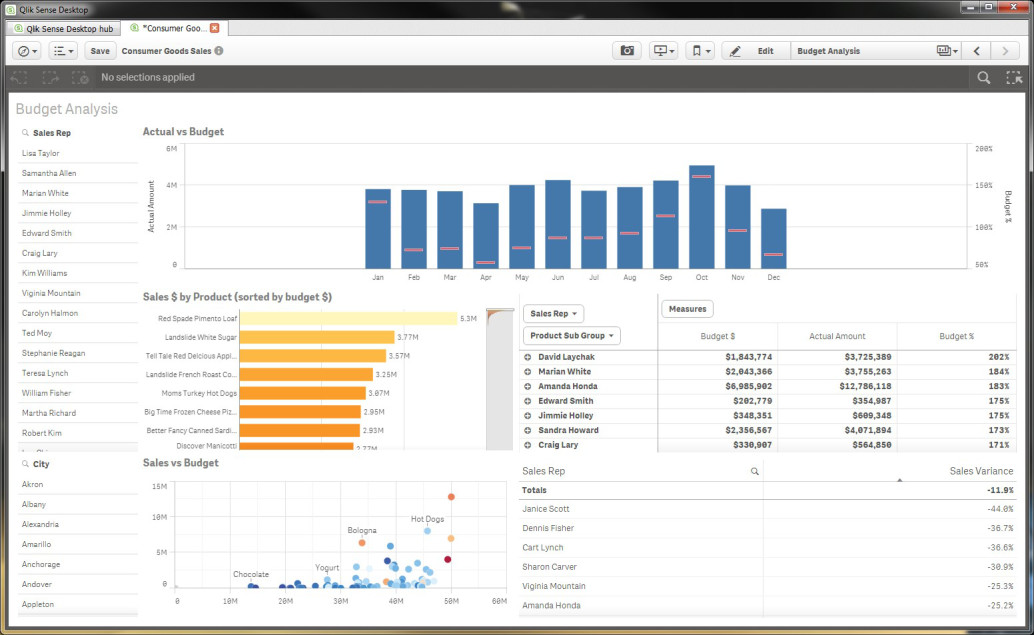
For some people the ability to ask questions of the data and get sub-second responses with the answers is the essence of empowerment and self-service. We can see below that the powerful associative QIX engine and the unique Green, White and Grey approach allows users to not only understand their data better, with its associations clearly being shown, but they also have the ability to ask the most important question first. What matters most to you in a particular set of data? Everyone wants something slightly different from the same data your organisation holds so why force people down the route of specific hierarchies or static reporting?
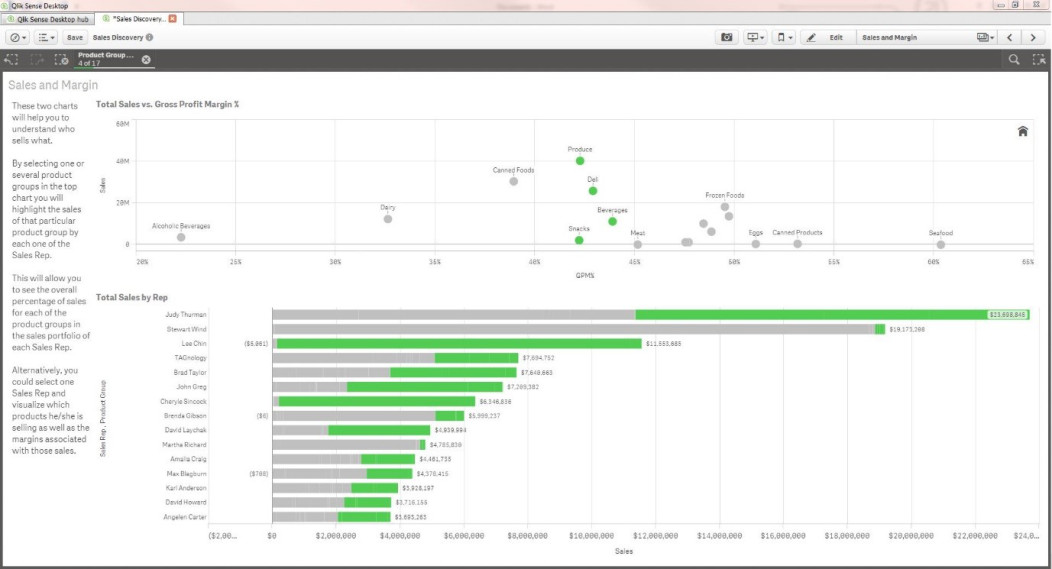
The chart above shows the sales reps that are selling the products selected in the 40% – 45% Gross Margin % bucket, but it also shows the proportion those products make of their overall sales.
Level 2 – Nearly there
With the release of Qlik 2.1 users can now manipulate and make subtle changes to the look and feel of a dashboard that has already been created for them. Maybe a report that I’m doing for a customer would be better positioned if I showed the bar chart orientation differently or I can highlight an issue clearer if I change the colour palette on a visualisation. This can all be achieved with, quite frankly scant knowledge of designing dashboards, and just the ability to use a right click on your mouse.
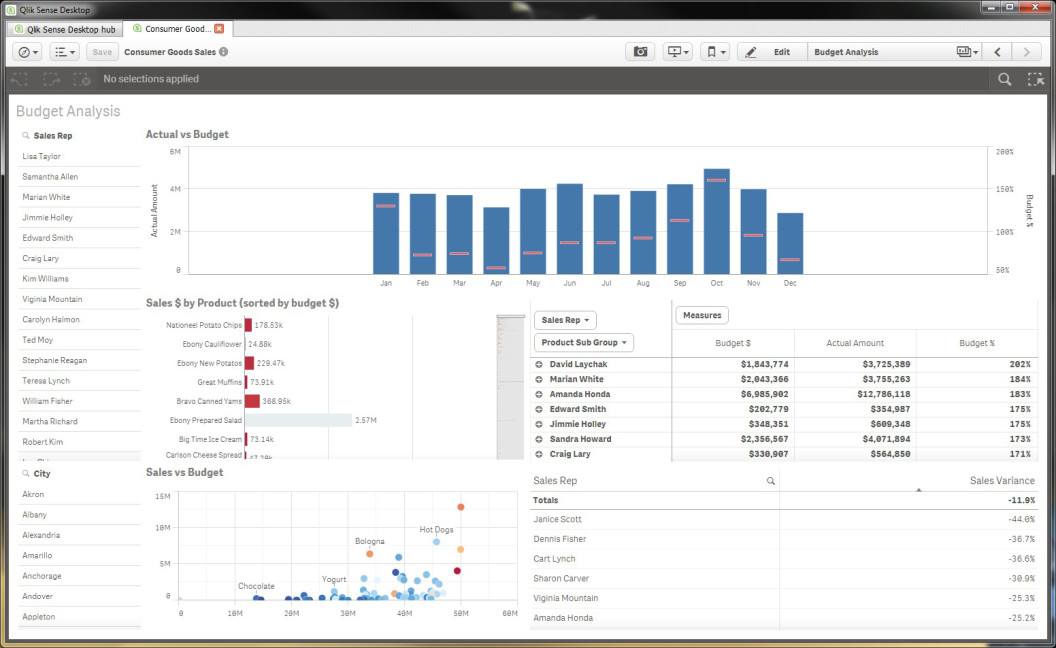
What you can expect from a Qlik Sense Dashboard as standard.
Right Click in the chart you wish to amend as a consumer of the dashboard and data.
Open the exploration menu and some end user options appear in a navigation pane on the right.
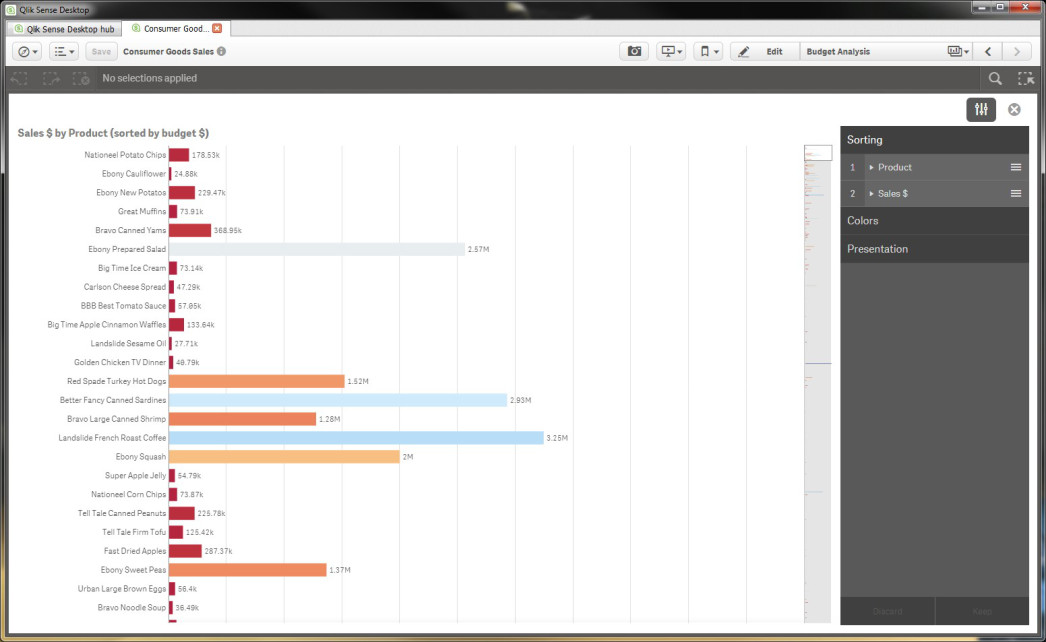
This shows that I can change the sort orders to suit my preference and show the top products by Sales.

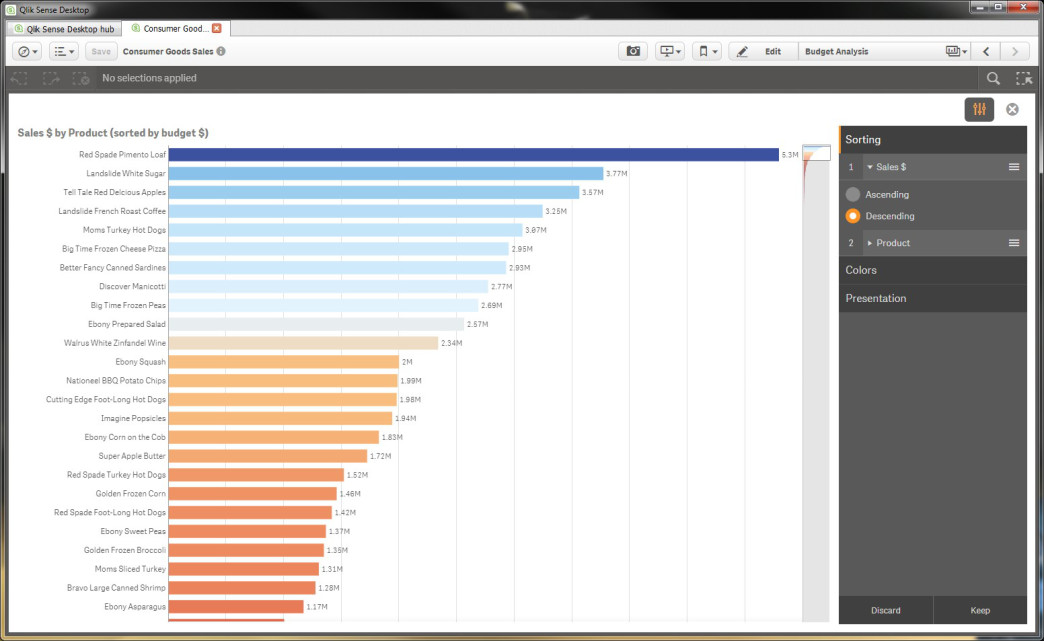
Now I want to see the colour show a sequential gradient and incorporate a legend.
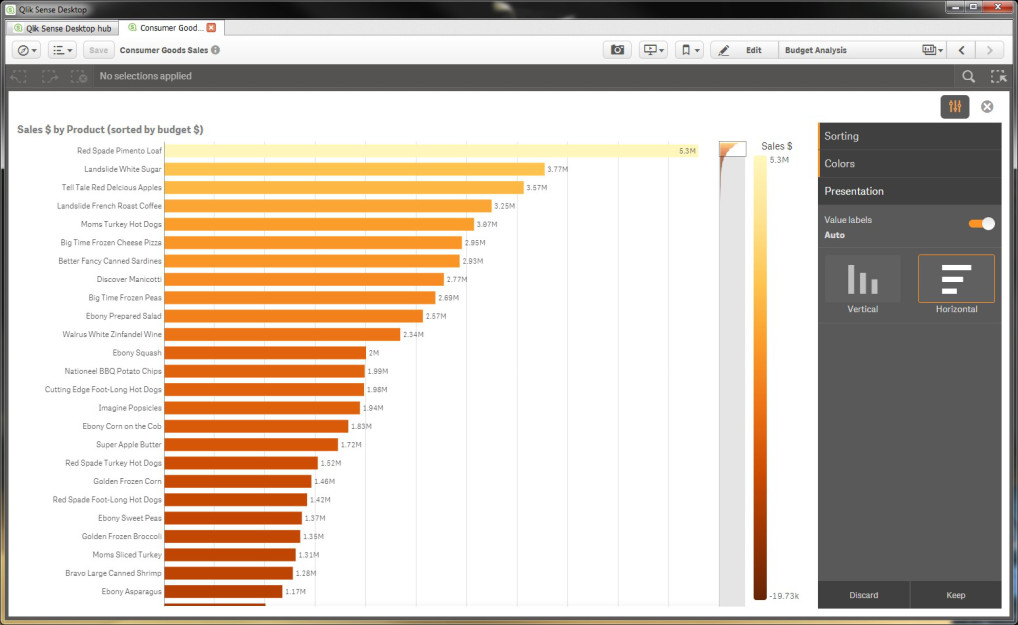
I could also change orientation, but I like my horizontal view.
I accept and keep my changes and my chart is updated. This is now my view of that chart and I have not altered it for anyone else in the organisation.
Level 3 – I like it more my way
It’s great that Qlik Sense allows guided analytics for organisations, but when a centralised team creates all the layouts for an entire organisation are we perhaps missing out on relationships between data by not having the necessary charts aligned by each other? Could it be that the people in the Marketing, Sales or Finance department for instance, actually have plenty to input about how they want their information represented on screen and what charts should be exposed next to each other?
By using the Master Visualisations in Qlik Sense an organisation can benefit from the collective intelligence of its users. Allow people to set out their own dashboard how they want it to appear whilst still keeping a solid governed data model where manipulation of calculated fields like Margin % and fees earned can’t actually be changed.
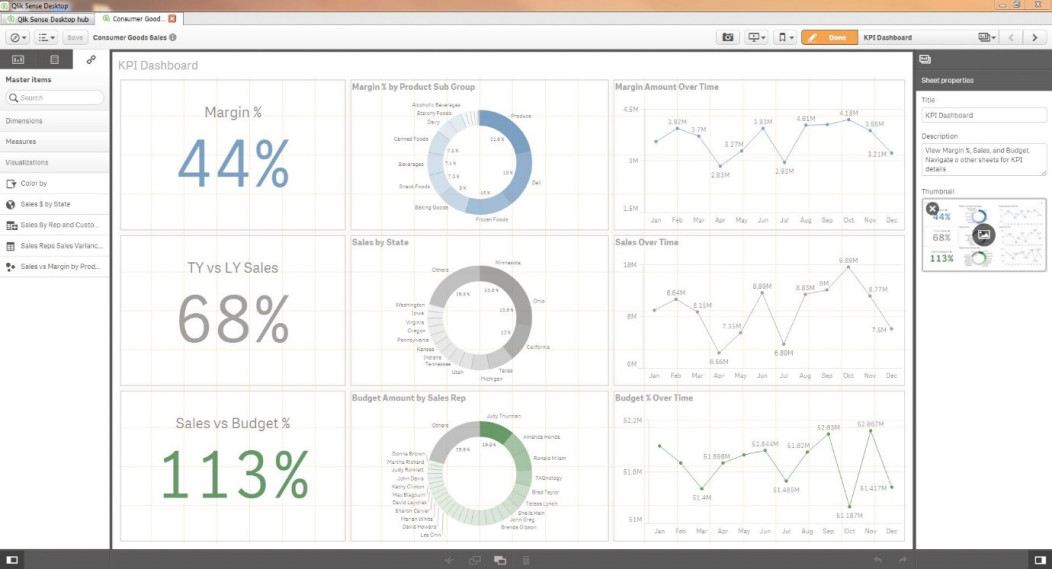
This shows the Master Visualisations on the left pane. Users can drag and drop and create their own layout to a dashboard without having access to change well governed and secure data.
Level 4 – But I’m an analyst
If you are an organisation that has members of staff with a remit to dig a bit deeper in to the data you are privy to, then you’ll probably want to allow a little more leeway to manipulate and play with the data. It may still not be right to go ahead and change the data that is coming in to your reporting model from the source systems but once that data is there, you need intelligent folk to make Sense of that data. This could include making new calculations, creating new visualisations that help interpret the data and lead to better insights and strategic thinking. Again this can all be wrapped up in that self-service phrase and yes Qlik Sense still allows this level of self service.
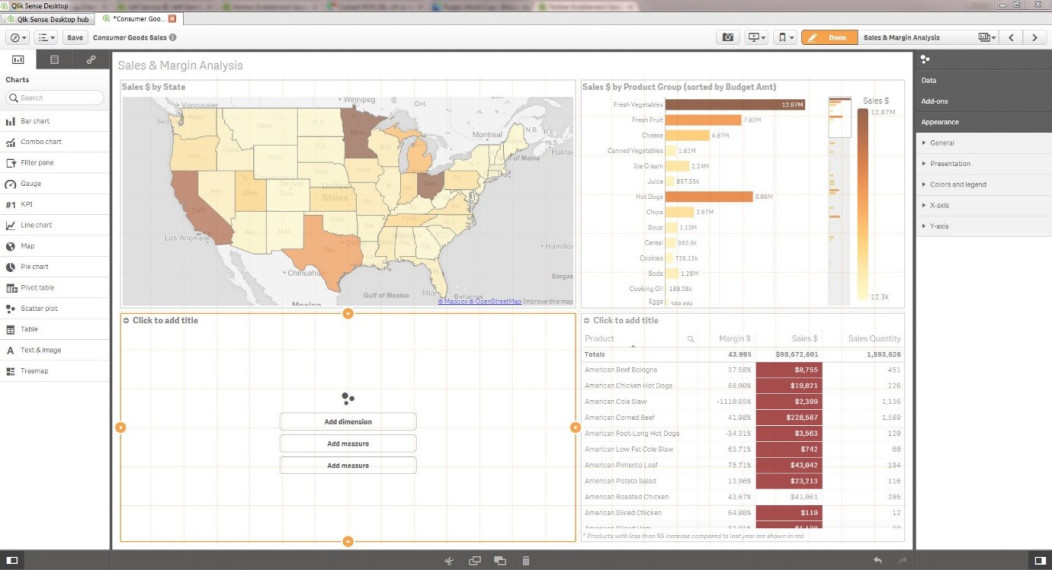
The screen above shows the ease of drag and drop to create a new visualisation, all the pointers are there to help understand what is needed, so in this case I would need a dimension (Customer maybe) and 2 measures (Sales Amount & Margin %) for the creation of a new scatter plot.
Level 5 – I know where it all lives
Sometimes you have that person that just knows how things work, that might even be you! You don’t need to wait for release cycles of work to get to the data that is going to serve you best and quickly too. With the right permissions then you can serve yourself to the data you need to help you make decisions and understand what is happening. That could be data that lives in source systems, third party systems or web based providers, social data, or even the inherent DataMarket information that you can have access to in Qlik Sense. DataMarket provides fully integrated data loading from external syndicated data sets that is no more difficult than if the data was on a spreadsheet on your network. Data sets include libraries of demographics, currency, weather, business and economy, with more getting added on a regular basis.
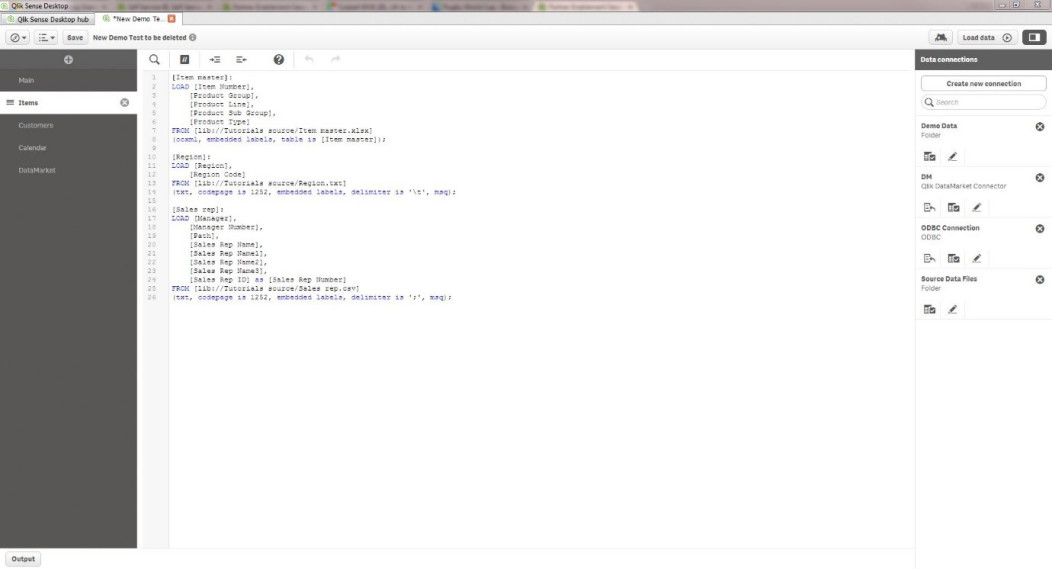
Data sources on the right show that the data you need is easily accessible for the most advanced Self-service user.
Summary – Truly the most flexible self-service BI on the market.
Whether you need to completely manipulate your data from source, create your own calculations and connect to external sources too (DataMarket), or if you wish to have things delivered to you on a plate ready for you to make meaningful selections and insights Qlik Sense can handle your self-service needs.
This blog post focusses on the needs from a self-service perspective, it’s quite possibly and even likely that the elements discussed are split responsibilities in your organisation. Just rest assured that the controls, security and restrictions can be applied again at the level that suits you.
Ometis have been early adopters of Qlik Sense and we see many of our customers realising the benefits of their ‘self-service platform’. So when you are next searching the market for a BI product that allows self-service ask the question; “Does it have the right level of self-service?” and find out if it does. Better still speak to us about Qlik Sense as we already know it can!
Andy Patrick is the Sales Manager for Ometis and has been an advocate and user of Qlik Products for 7 years.

Comments