

I’d strongly recommend any Qlik Sense user who builds apps to learn the benefits of calendar definitions, also known as a time-aware calendar.
A time-aware calendar can be critical to a Qlik Sense app, largely due to time being one of the key fields that drives a user’s analytical exploration. If you are coming from a QlikView background into Qlik Sense, you may want to throw away your master calendar script at this point!
What’s a time-aware calendar?
A time-aware calendar is a calendar definition which extracts key time elements from a single date field, such as year, month and week. The definition dictates how each of these derived fields should be displayed, sorted and used within visualisations.
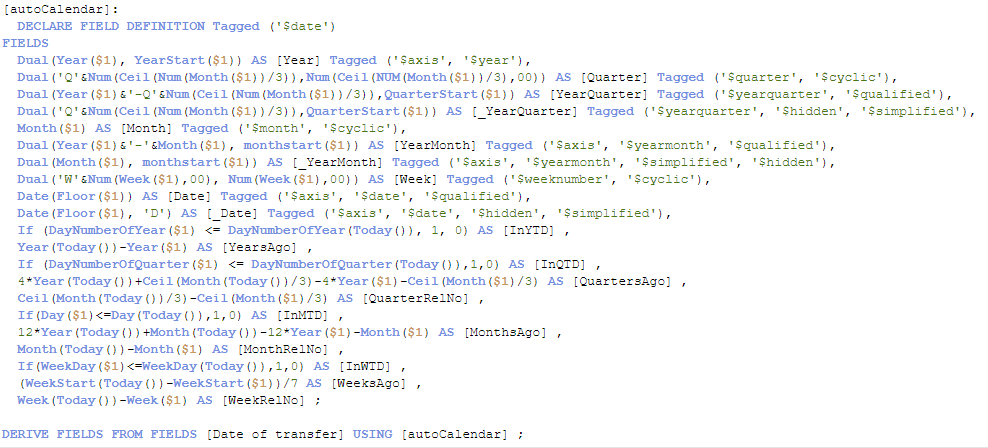
If you have used the Data Manager before then chances are you have come across a time-aware calendar. Providing you have loaded a date field, you should see a bit of script in the auto-generated section named ‘autoCalendar’. If you’re curious, it looks like this:
When a field has a time-aware calendar applied to it, the field will be prefixed with a calendar icon in the field list:
![]()
Simply click on this field and it will expand, providing access to the derived date variations from the original field.
What are the benefits?
1. Highly efficient and optimised
Put simply, a time-aware calendar is a highly efficient and optimised method of creating date variations from a single date field – even more so than the typical master calendar script, established with QlikView.
2. Scaling
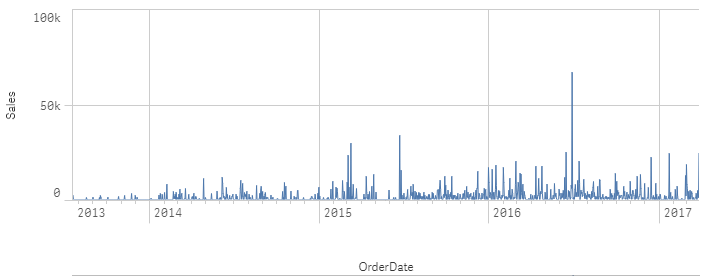
Only with a time-aware calendar can you also create time-aware charts; enabling continuous scaling on the x-axis.
Starting with the higher-granularity values such as year:
Following through to the lower-granularity values such as month or date:
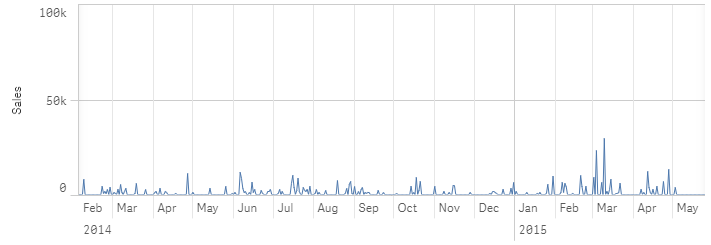
Each tick (line) on the x-axis represents a data point – a year, month, date, etc. Scaling is the process which changes the width of the gap between each tick. By default, a chart view is compressed – this empowers the user to visualise many data points without the need to scroll. As the user scrolls into the chart view, the gap between two ticks grows and, as this happens, Qlik dynamically interchanges the date value. For example, by default Qlik may show one tick per year i.e. 2018, as the user scrolls into the data the month ticks appear along with the month values i.e. 2018-Jul, 2018-Aug. When fully expanded, Qlik will show the chart view at a second-interval, regardless of the granularity of the data itself.
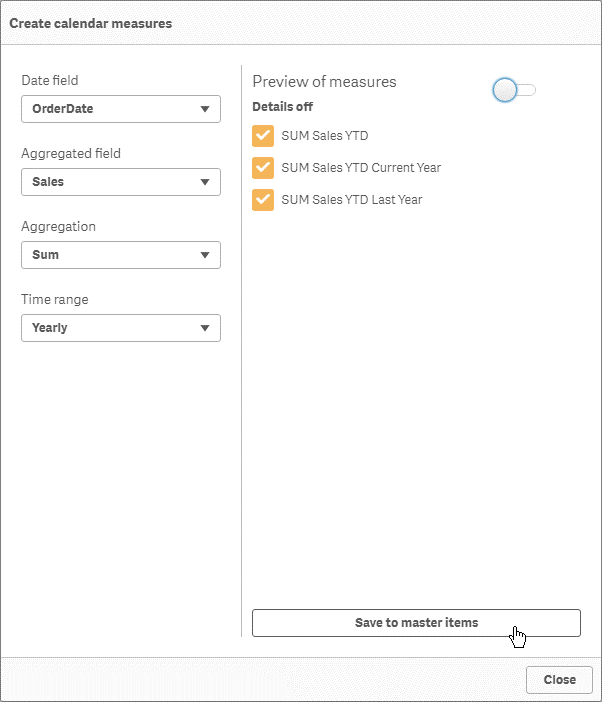
3. Calendar measures
Last but no means least, you can create calendar measures with just a couple clicks. Enabling users to right-click on any field, with the ability to create expressions limited to a particular date range, such as current or last-year calculations.
How do I create a time-aware calendar?
There are two main methods for creating a time-aware calendar, the obvious one is to write the calendar definition from scratch or copy from another application. The second is to use the Data Manager.
The Data Manager writes the code on the user’s behalf, offering them a user interface to transform their data from raw to ready. Since November 2017’s release, I have found myself defaulting to the Data Manager initially to load and transform my data. This is because it’s become advanced enough to handle 80 per cent of transformations and implements them with best practice in mind. The Data Manager makes me more efficient, instantly provides a preview of the transformations (without requiring a reload), allowing me to rapidly prepare the data.
Regardless of whether you load data directly into the Data Manager or synchronise your scripts after, it will provide a time-aware calendar for any detected date fields, but also profiles your geo-spatial data too; mapping in country alias’, ISO code, polygon information etc.
There is a third option which I will come to later!
Give me the basics!
There are three core components of a time-aware calendar; declaration of the definition, assembly of the fields list, followed by mapping data fields to the calendar definition.
The first component is to declare the definition. As shown in the first image above, a definition name is specified along with the declare statement:
[Definition name]:
DECLARE FIELD DEFINITION Tagged (‘$date’)
It’s important to note that you shouldn’t use ‘autoCalendar’, as this name is reserved for the Data Manager.
Following the declare statement, the ‘field definition’ is stated informing Qlik we are going to provide a list of fields to be generated. Optionally, you can also add a tag list, ‘Tagged (‘$date’)’. While this is optional, it is best practice to include the tag list. This is because it adds the tags to all the fields generated. Tags assist Qlik with determining the sort order, therefore the tag ‘$date’ will result in Qlik sorting the values by the date in ascending order, otherwise the load order will be used – typically, this isn’t what you want.
The second part is the field list. For example:
Dual(Year(YEARSTART($1)), YearStart($1)) AS “Year” Tagged (‘$axis’, ‘$year’)
The field list is similar to a normal LOAD script in appearance, the main difference is that a single data field is used to generate derived fields. I won’t go into each function used in the expressions as far to say the typical makeup of a field is stated below:
<expression> AS <field name> tagged <tag>
When using non-numeric or date functions, it is best practice to use the DUAL statement to provide both numerical and an appealing text representation for a single record. This enables Qlik to sort the values correctly. When using an expression, the ‘AS’ statement must be utilised to provide the field with a name. Again, the tag list is optional but, as mentioned before, it is best practice to add tags. For derived fields, tags are used to specify how to use and display the fields in a time-aware chart.
There are five main tags you should be aware of:
1. $axis
When this tag is present, the field should generate a tick on the continuous axis of a time-aware chart.
2. $simplified
This tag should be used in conjunction with the $qualified tag. A field tagged with simplified is shown when the context of the upper derived field is still in view. This field will be a shortened version of the qualified field, such as ‘Jan’ or ‘Feb’ for the YearMonth.
For example, if a user scrolls from year into months, and the year tick is still in sight then each month tick will be shown with just the month name and not the YearMonth:
3. $qualified
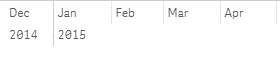
This tag should be used in conjunction with the $simplified tag. A field tagged with qualified is shown when the context of the upper derived field is lost. This field will be a lengthened version of the simplified field, such as ‘2018-Jan’ or ‘2018-Feb’ for the YearMonth.
For example, if a user scrolls enough that the next derived fields ticks appear then Qlik provides more context by using the full YearMonth:
![]()
4. $hidden
This tag is used to hide a field from the fields’ list. While the field can still be used as any other field, the user must type out the full field name and therefore know it exists in the application. This tag is commonly used in conjunction with the $simplified tag.
5. $cyclic
In my current findings, this tag has no significant impact on the definition. However, it is listed on Qlik’s help site as being used for cyclic fields, hopefully someone from Qlik can inform us of what it actually impacts. It’s also worth noting that Group definitions are listed on the help site, with drill-down and collection options but again they don’t seem to have a purpose at the moment. There was a question on the community about this dating back to 2015, in which Mike Tarallo stated a feature that utilises this function had been implemented in the back-end but not yet exposed in the UI, a link to that post is here.
The last component is mapping the data field to the calendar definition. This is achieved using the Derive statement:
DERIVE FIELDS FROM FIELDS <comma separated field list> USING <calendar name>;
You can specify multiple fields in the fields list, separated by a comma. It is also possible to reuse a calendar definition multiple times. In more complex examples of calendar definitions, you can pass parameters from the Derive statement to the calendar definition. This can be a very effective method of creating multiple calendar variations with a single definition.
Nuisances
Having said all this, there are a couple of little pains I’ve come across while investigating calendar definitions. For example, the order in which you specify the field list can impact how and what is displayed in a time-aware chart, you should always define your field list it’s natural hierarchy, starting with the higher granularity first (i.e. year) and finishing with the lowest (date). Any miscellaneous fields, such as flags, should be placed at the end.
Secondly, calendar definitions can become overly complex with bespoke calendars, such as 4-4-5 calendars or where the first day of the month isn’t the first etc. In addition to this, Qlik only seems to add a tick for equal intervals. Therefore, broken weeks don’t display completely in a time-aware chart. I’m not saying it’s impossible to create a definition for these use-cases, but it certainly makes it more difficult.
Show me the money!
With an understanding of the basics you are empowered to modify the calendar definition to suit your needs and the needs of your organisation. For example, if you want to create a YearWeek field, and have it appear on the axis of your time-aware visualisations, you could add something like this:
DUAL(weekyear(ADDMONTHS($1,1 – paramFirstMonthOfYear))&’-W’&Num(Week(ADDMONTHS($1,1 – paramFirstMonthOfYear),0,0),00), weekstart($1)) AS “YearWeek” Tagged (‘$axis’, ‘$yearweek’, ‘$qualified’),
Dual(‘W’&Num(Week(ADDMONTHS($1,1 – paramFirstMonthOfYear)),00), weekstart($1)) AS “_YearWeek” Tagged (‘$axis’, ‘$yearweek’, ‘$simplified’, ‘$hidden’)
With that said, remember when I said there is a third method for creating a time-aware calendar?
Well there is!
Give our Time-aware calendar generator at www.ometistoolkit.com ago.
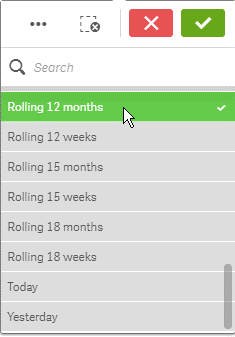
Here you can create a new bespoke definition within a couple clicks, and copy or push it to your Qlik Sense app. It can cater for missing dates, financial calendars, and it can even create a list of report periods for users to select with ease:
Conclusion
Calendar definitions should be a fundamental addition to any Qlik Sense app that includes a date field. It has little to no impact on reload times, enables users to view the trend of many data points through continuous scaling, and empowers users to create time-based measures within a few clicks. In fact, unless you are using a highly bespoke calendar I struggle to see a downside, nor a valid reason to neglect using one. In a nut shell, calendar definitions further aid a user’s ability to self-serve and visualise large datasets with ease.
By Christopher Lofthouse


.png)
Comments