

The Qlik Cloud January and February 2023 releases saw extensive updates. Martin Appleford-Cook examines the new additions to the platform at the beginning of 2023 and how they benefit users.
Platform, Admin and App Development updates
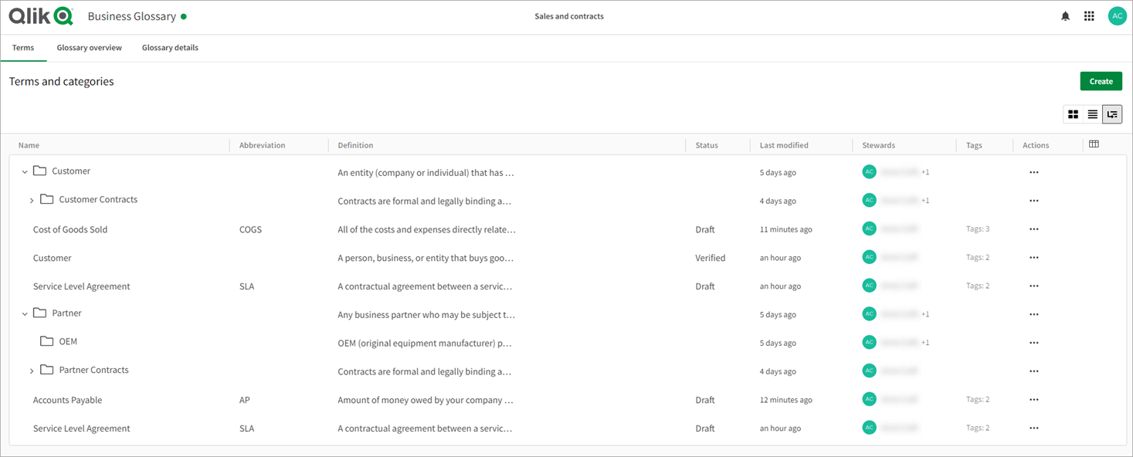
Improve data discovery and collaboration with Qlik Cloud Business Glossary
Qlik Cloud Business Glossary has been introduced as part of Qlik Cloud Analytics. This enables the app developer (data steward) to create and maintain a database of business terminology, definitions and descriptions. A shared understanding of terminology is fundamental for data discovery and collaborating across departments, because it:
- ensures that everyone in the organisation speaks the same language.
- streamlines data-based decisions.
- simplifies regulatory compliance.
Troubleshoot app reloads with four new error messages
Previously users would be notified when reloads Succeed, Failed and Exceeded_Limit. Now you will also be notified when the following occurs:
- Fail: An engine connection error prevents a reload.
- Fail: An issue with session fetching causes a reload to fail.
- Fail: Engine openDoc issue leads to a reload failure.
- Fail: Reload fails due to permission issues.
Improved user management in the Management Console
User management in the Management Console has been improved. The user pane now provides configuration of user entitlements, and the user entitlement is now a field associated with the user. This move allows for all user admin to be carried out in a single area.
New pane for monitoring capacity consumption in the Management Console
The Home area now includes the capability to monitor capacity consumption. This area within the Management Console provides an overview of the consumption relating to users, reports and other capacity-based resources. It also provides information around your subscription.
New chart functions for custom app navigation
There are two new chart functions that enable the creation of guided applications with custom navigation functionality:
- InObject() chart function evaluates whether or not the current object is contained inside another object with the ID specified in the function argument. The object can be a sheet or a visualisation. This function can be used to show the hierarchy of objects in a sheet, from the top-level sheet object to visualisations nested within other visualisations. This function can be used alongside the if and ObjectId functions to create custom navigation in your apps
- ObjectId() chart function returns the ID of the object in which the expression is evaluated. The function takes an optional argument specifying which type of object the function concerns. The object can be a sheet or a visualisation. This function is only available in chart expressions.
Tutorial for performing time series decomposition in Qlik Sense
A new tutorial demonstrates how to use three chart functions to decompose a time series using the STL algorithm. Using time series data and the STL_Trend, STL_Seasonal and STL_Residual chart functions, the tutorial shows users how to build two line charts to provide further insights into the data. Seasonal, trend and residual components then help identify a recurring seasonal and general trend in the underlying data.
Structure Direct Query apps with script variables
You can now use script variables to describe and manipulate the internal structure of a Direct Query app. Using the script variable DirectQueryRowFetchMaxCount for example allows an application to specify the maximum number of rows that will be fetched per chart from the remote database.
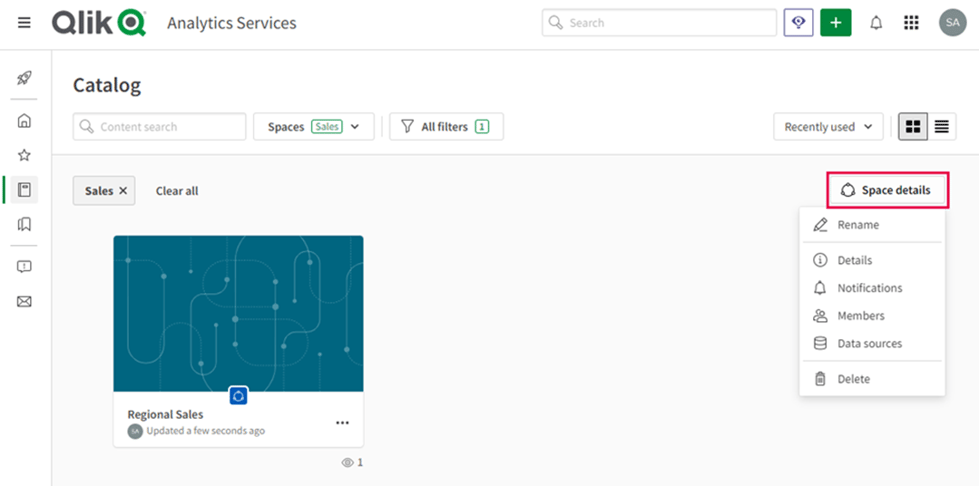
Update to Catalog
‘Space details’ is the new name for ‘Manage space’ within the Catalog section. This area within the hub displays details around the space including details, notifications, members and data sources.
Improved user and group management with SCIM
Qlik Cloud now supports SCIM. System for Cross-Identity Management is an open standard, and assists and automates between identity providers and applications. With this new support Qlik Cloud simplifies user management. It also ensures that user information is consistent across systems and helps users get access to the relevant areas across multiple systems.
Application Automation updates
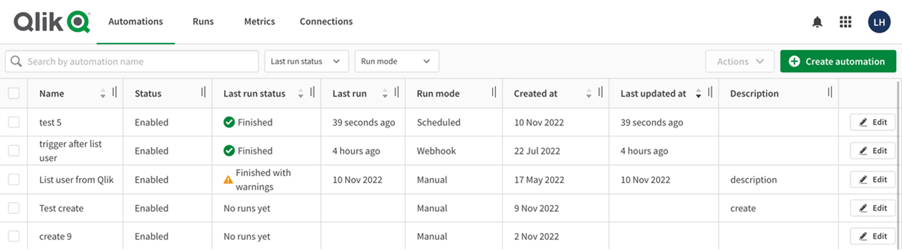
Monitor your automations intuitively in the hub
A new centralised overview page makes it easier to monitor application automations. The metrics view provides an informational snapshot of all your automations and you can now search, edit, activate and export automations. Additionally, a history view assists with troubleshooting and debugging by showing duration, status and history of your automations.
New templates
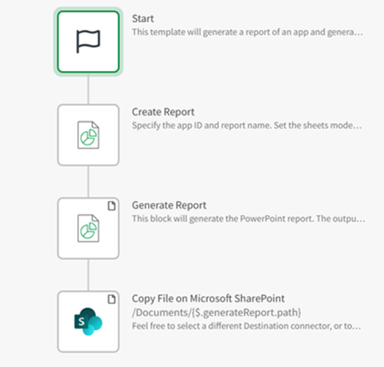
Store a simple multi-page PowerPoint report to Microsoft SharePoint:
With this template, you can now generate a report that includes all public sheets with no selections applied from an app. Users can save a report as a PowerPoint file inside Microsoft SharePoint, with a possibility to only choose a subsection of the sheets.
AutoML updates
New algorithms for Qlik AutoML
There are two new algorithms within Qlik AutoML: CatBoost and LightGBM. These models can be used for binary and multiclass classification problems as well as for regression problems.
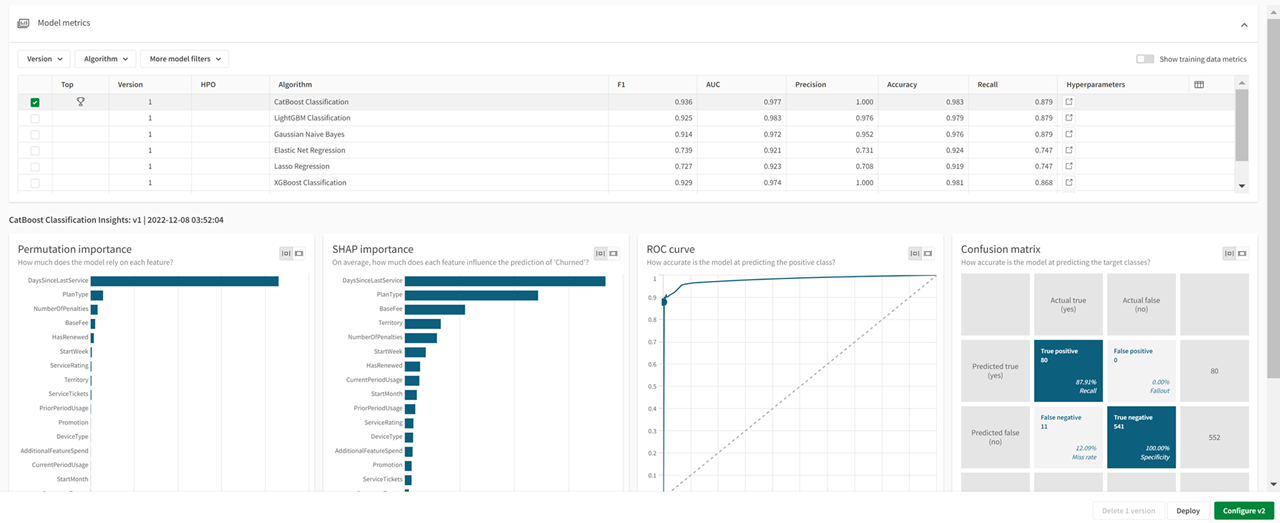
Improved model filtering in Qlik AutoML
A new re-designed and improved filtering mechanism in the Model metrics table has been introduced into Qlik AutoML. Some toggle filters have been replaced by dropdown filters to select specific algorithms and model versions. These changes provide further options and filtering to all for combinations of options to then show the user any of the metrics that match their selections.
Updated tutorial for Qlik AutoML
The tutorial for AutoML now includes new guides for creating ML deployments, predictions, and prediction apps. These additions show users how to work with output generated from a prediction, including how to build out a data model and create visualisations to show SHAP and prediction data.
Updates to Databricks MLflow connector
An update to the Databricks MLflow analytics source now includes compatibility with machine learning models created with version 2.0 of Databricks MLflow. You can also set during configuration version 1.0 or 2.0.
Visualisations updates
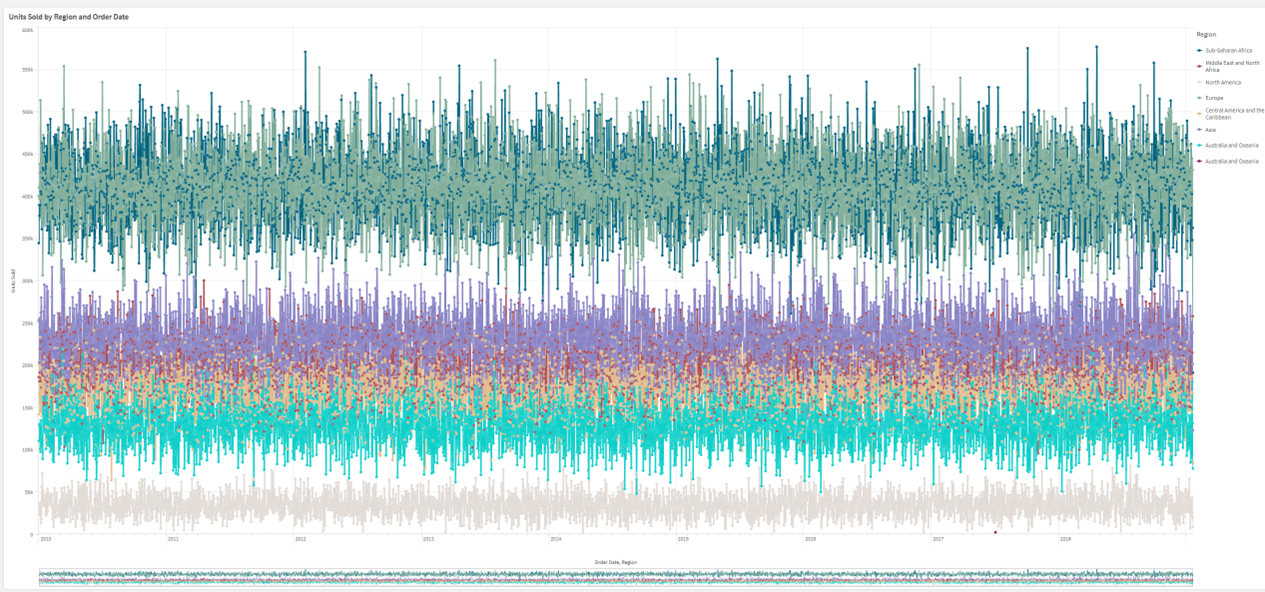
Line charts can display larger datasets
App developers now enjoy greater flexibility around how many visible points they can display on a line chart. Continuous dimension axis line charts can now show up to a maximum of 50,000 visible points and 1,000 visible lines.
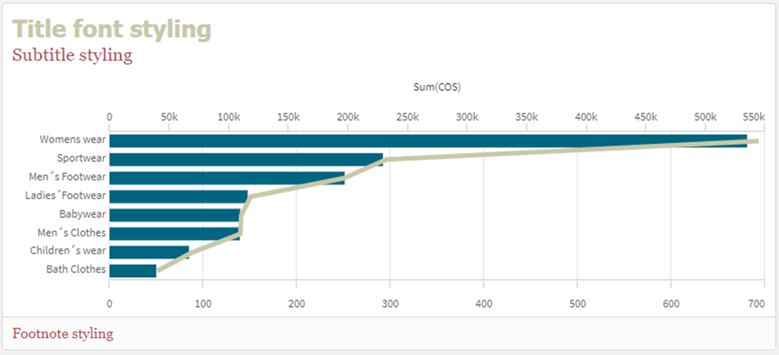
Updates to font styling for scatter plots and text & image objects
Font styling for titles, subtitles and footnotes in scatter plots and text & image objects. This includes font type, size, colour and emphasis, giving app developers more freedom to customise and tailor to their own designs and branding.
Add background colours and images to straight tables, pivot charts, pie charts, and bar charts
Custom background colours and/or images can be added to straight tables, pivot charts, pie charts and bar charts. App developers can select a single background colour or colour by expression
Updates to font styling in bar charts
Styling of fonts used for axis labels and titles can now be carried out – the font, font size, and colour can all be customised under the chart tab.
Direct Query is now supported in the variable input control
Variable input controls within the Dashboard bundle can now utilise Direct Query. By using a variable control to hold the chosen value, users can directly access data from its underlying data source as opposed to in-memory. This complements their pre-loaded data and so gives them the best of both worlds within apps and visualisations.
Connectivity updates
Increased security in Google BigQuery and MongoDB connections
The Google BigQuery and MongoDB connections can now be configured to ask for user credentials. Similar to other ODBC connectors, it belongs to a user rather than the entire connection. These user defined credentials can be saved and used in multiple connections of the same connector type.
Qlik Data Gateway – Direct Access updates
A new release of Qlik Data Gateway has been released (Version 1.2.0) and is available for download. This version adds support for SAP SQL and SAP BW connectors and resolves a couple of issues. The new SAP SQL and SAP BW support includes the ability for an encrypted connection and allows apps to access these data sources with added security.
The resolved issues are improved stability, recoverability of the underlying service ensuring that users don’t need to restart the service. Secondly, administrators can now overwrite the Direct Access Gateway installation and configuration parameters. With the new 1.2.0 release version 1.0.0 is no longer supported.
New authentication methods for Azure SQL database and Azure Synapse Analytics connectors
Two new authentication methods are now supported:
- Azure OAuth – allows a single sign-on (SSO)
- Azure Active Directory – protects user identity and simplifier the sign-in experience
New storage provider connector for SFTP
A new storage provider connector has been added. SSH File Transfer Protocol is a secure file transfer protocol and assists organisations with GDPR and other regulatory rules for file transfer compliance. The new SFTP connector lets users download/upload files to secure locations. You can also browse these locations that the SFTP user has access to. They can then retrieve the data and use it within their apps.
Data Integration updates
New Qlik Cloud Government support for data integration and analytics
Qlik Cloud Government now includes a number of new Qlik Data Integration features.
Qlik Cloud Government now provides a set of data integration features and capabilities that help data engineers deliver, transform, and unify enterprise data via automated, efficient, and governed data pipelines.
It also now supports Direct Query. The Direct Query tool helps by leaving the data at its source, without requiring it to be read into memory. Combined with the in-memory capabilities of Qlik Cloud, this provides a hybrid approach which allows customers to blend near real time and pre-loaded data. It also increases the speed at which recently updated data can be viewed within apps.
Lastly, Qlik Cloud Government now includes Qlik Data Gateway – Direct Access. This feature provides users with a secure capability to access their data behind a firewall and only via an outbound mutually authenticated method.
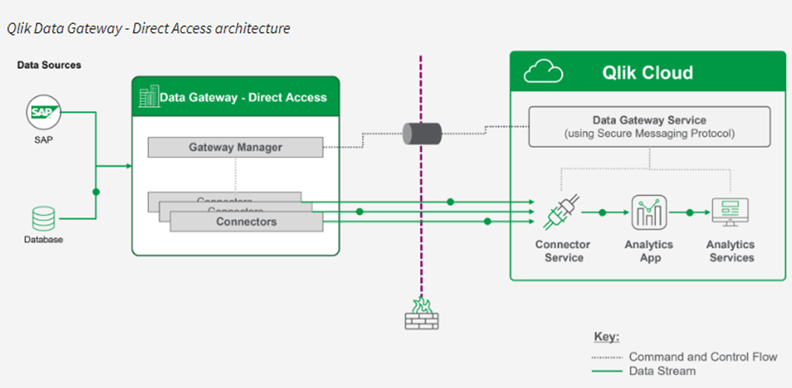
A key benefit of this method is that an organisation doesn’t need to open their firewalls for incoming connections. This ensures that their strict security policies are met.
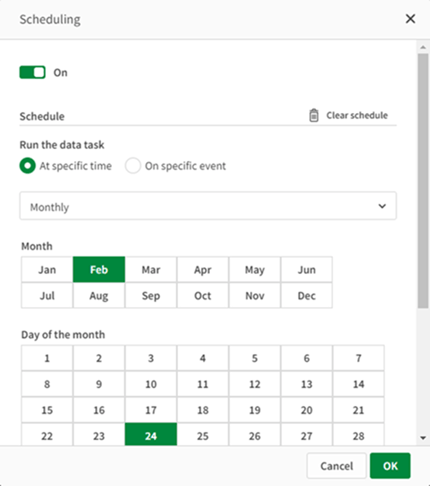
Qlik Cloud Data Integration pipeline scheduling changes
More advanced task scheduling options which provide more dependency control, execution flexibility and performance optimisation have been implemented in the latest release. New options provide regular interval scheduling such as minutes, hourly, daily, weekly, monthly, or particular dates and times. You also have the option to schedule a task based on a specific event, such as successfully completing a prior task.
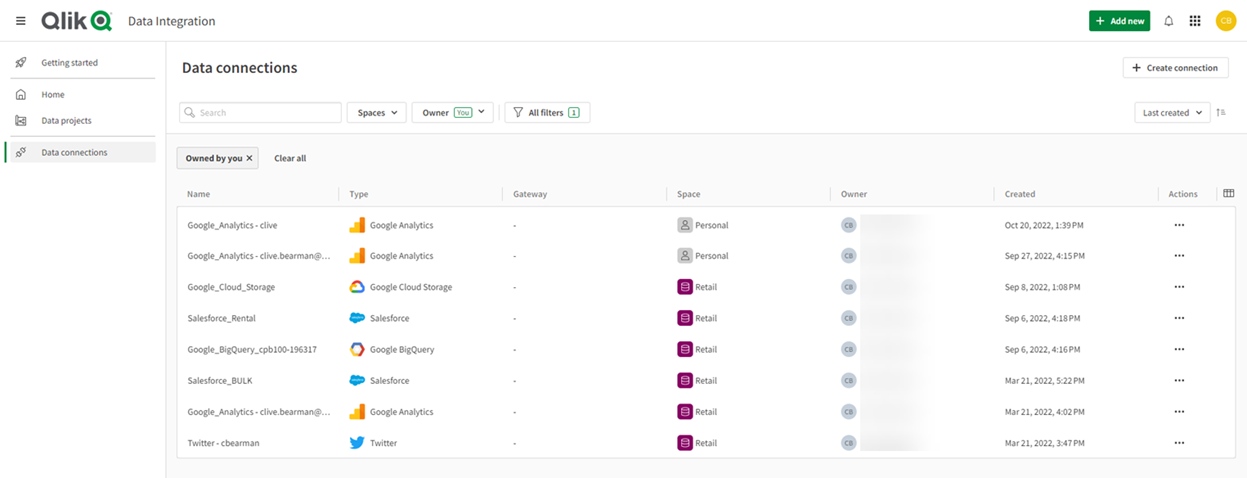
New data connections view in Qlik Cloud Data Integration
Within Data Integration there is a new summary view. This view provides users with a quick way to see and edit all of their data connections. To see this new view, users need to click on the Data Connections link on the left hand side as shown below.
Use Amazon Redshift as a data platform
You can now land and store datasets in Amazon Redshift with Qlik Cloud Data Integration.
Microsoft Power BI Connector in Qlik Lineage Connectors now supports GCC and GCC High
The Microsoft Power BI Services lineage connector now supports GCC (Government Community Cloud) and GCC High environments. Edit your Power BI Authentication URIs to access these cloud environments.
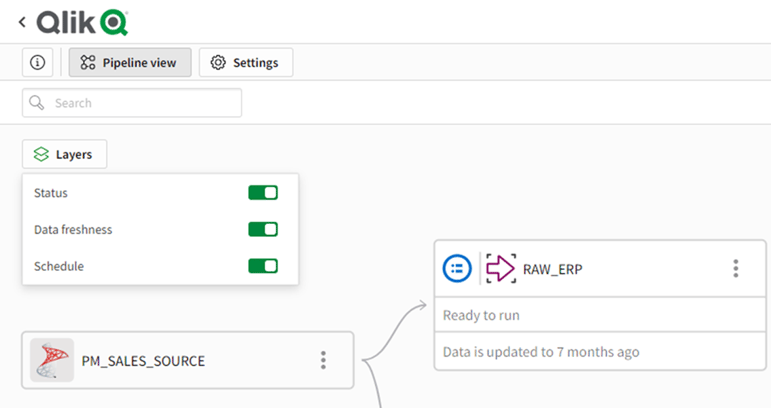
New project pipeline view in Qlik Cloud Data Integration
A new view called Pipeline view in Qlik Cloud Data Integration allows users to view or hide data freshness, status and schedule information for all data tasks. Users therefore now have better control over what level of detail is shown.
Change file formatting directly in Qlik Catalog
It is now possible to change and customise the file formatting of certain dataset types in Qlik Cloud Analytics. In the previous release, any changes in formatting required a re-upload and edit of the data source.
Reflection of Qlik Cloud January + February 2023
The first couple of months of 2023 have seen quite a few updates across all areas of Qlik Cloud. These have encompassed administration, app styling, connectivity features, right through to AutoML and Qlik Data Integration. A great start to the new year that has enhanced all areas of the Qlik Cloud platform.
A great new addition to the platform is the ability to maintain a shared repository of business terms, definitions and descriptions via Qlik Cloud Business Glossary. This tool helps organisations to standardise a business glossary that can be shared across multiple Qlik tenants and is essential for data discovery and collaboration across departments. Business glossaries are a resource type in Qlik Cloud. They consist of logical categories populated with terms described in clear language that everyone across an organisation can refer to and understand. In addition, they help users locate standard information, definitions and answers to business questions. This provides context to apps and data sets, and ensures collaboration between user groups and lines of business.
Improvements also include security around connections to Google BigQuery and Mongo DB. Individual user credentials provide greater flexibility around those connections and enable a tailored approach rather than a single login. There has also been an update to authenticating against Azure SQL databases and Azure Synapse Analytics via single sign on. This simplifies the connection and adds a more secure and streamlined approach.
Application Automation has seen improvements. A centralised area now highlights all the relevant information around automations, as well as their history and statuses. Users can now quickly and easily search, activate and export automations. Additionally, a new PowerPoint template lets users generate reports and export them to SharePoint with a simple automation.
To finish, a number of updates have occurred around chart configurations. The first of these gives users greater flexibility around the maximum lines and points they can set in a line chart. It has been upped to 50,000 points and 1,000 lines which should give app developers more freedom for visualising data for their end users. The second is font styling on scatter plots, text & image and bar charts. App developers can now design their titles, subtitles and footnotes on their own. Lastly, custom backgrounds, colours and images can be added to straight tables. This can also be switched using expressions to enhance the overall design and impact of the object.


Comments