

I can’t believe it’s April already. Like clock-work Qlik have released Qlik Sense April 2019 and by golly it’s a good one!
Last year at Qonnections, the first iteration of the Associative Insights was revealed and was greeted with jaws dropping followed by gasps. Well… it’s here. Qlik’s Associative Insights is their latest Augmented Intelligence feature to considerably lower the data-literacy barrier and enable business users to answer the ‘what’ and ‘why’ questions. But first, let’s go through the improvements made in this release.
Improvements In Qlik Sense April 2019 Release
New default thumbnail
Starting with an obvious one, Qlik have changed the default thumbnail for an app – the infamous rings are no more in the Qlik Sense April 2019 release.
Changes to ‘Edit’ mode
Edit mode in Qlik Sense April 2019 has changed slightly. Firstly, the Edit button in a published application has been replaced with Duplicate ![]() , which makes total sense as you can’t edit a base sheet in a published app, only duplicate them. This means it’s now just a single click (on duplicate) to start editing a copy of the base sheet, before you would click Edit followed by the prompt to Duplicate – thus cutting the number of clicks in half!
, which makes total sense as you can’t edit a base sheet in a published app, only duplicate them. This means it’s now just a single click (on duplicate) to start editing a copy of the base sheet, before you would click Edit followed by the prompt to Duplicate – thus cutting the number of clicks in half!
Secondly, you can now resize the object anywhere along the boundary (and not just on the anchors) – which is great.
And lastly, it’s worth mentioning that Qlik have divided the sheet into 4 equally-sized drop zones (2 x 2).
Hub seems to load more quickly
I would like someone from Qlik to comment below on why this is but the Hub seems to be much faster to display, which is awesome!
Map chart enhancements
It is now possible to set a default map background for all new map objects created. This is achieved by editing the ‘mapconf.json’ file, located in ‘Program Files\Qlik\Sense\Client\assets’. If you want to set the default map background to an alternative option, you must specify the property defaultMap.
For example:
“defaultMap”: “pale_mercator”.
You can also use “satellite_mercator”. Likewise, you use a specific tile map service:
“defaultMap”:”http://tile.openstreetmap.org/${z}/${x}/${y}.png”
I’d strongly recommend using a tool like https://jsonlint.com/ to check your JSON is correct, like I had to. Once you have saved the file, users only have to refresh their browsers for the change to take place (you do not need to restart services). A full example is below:
{
“serverUrl”:””,
“serverKey”:””,
“defaultMap”: “satellite_mercator”
}
Secondly, you can add line breaks in labels, which provide more granular control over the appearance:

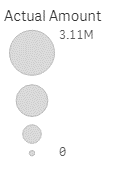
Next, Qlik have added a new size legend in Qlik Sense April 2019 for point layers which provides more context:
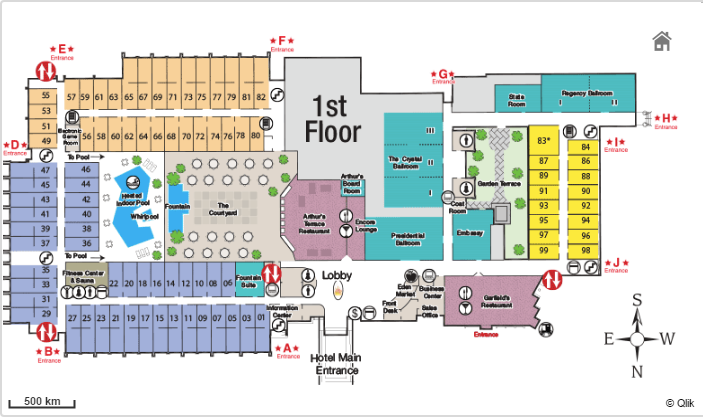
And lastly, a background layer now has the capability of inserting an image. This is particularly useful for our customers who want to show floorplans or development plots.
All these options are terrific improvements to the relatively new map object which was redesigned over the last 12-18 months. It’s nice to see it’s still evolving in the Qlik Sense April 2019 release!
Embed chart (single config on right click)
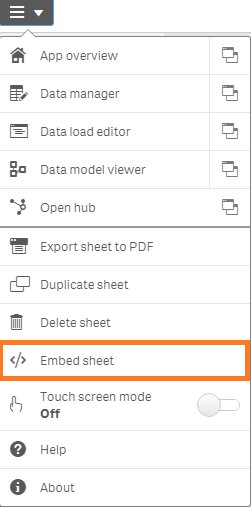
As you may already know, the ability to generate a link or iFrame to a Qlik Sense sheet or visualisation has been around for a long time, thanks to the Single configurator in the Qlik Sense Dev-Hub. As of April 2019 however, Qlik have added an Embed Sheet button to the Global Menu:
There is also an Embed chart button in the context menu (right-click) of an object:
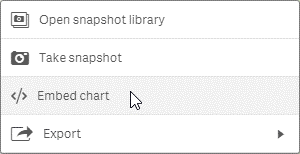
This now provides both Qlik Sense developers and users with quick access to generate those links from within the Sheet view.
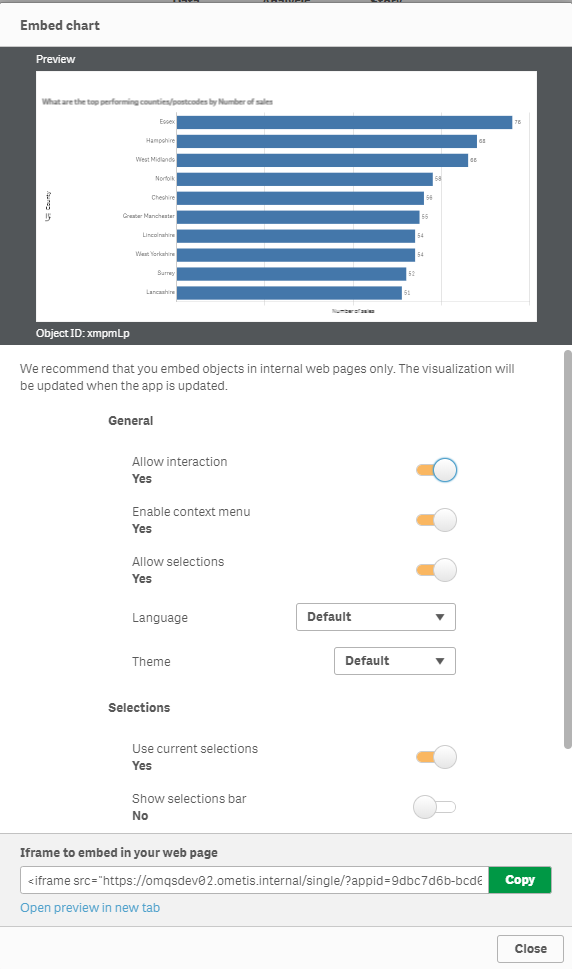
Using this much-improved user interface, you can preview the object, configure options for allowing interaction, selections, language, theme, menus and even specify default selections (either using current selections or a bookmark). Immediately beneath the preview you also can find the object ID – very useful for use with Qlik NPrinting, which saves having to use the ‘options\developer’ approach which requires a page refresh.
New features in Qlik Sense April 2019 release
Connector Logs Analyzer
This is a new monitoring log that lets administrators investigate patterns of activity and examine errors.

As always, you can import the extra monitoring log apps from ‘%ProgramData%\Qlik\Sense\Repository\DefaultApps\’.
Visualisation bundle
The visualisation bundle has two additions:
- Bar and Area chart – a bar chart with transition effects, connectors and labels on tacked bars.
- Bullet chart – a bar chart typically used for tracking towards a goal or showing targets.
In my opinion, while it’s nice to have these as options, they are not self-service ready. The inconsistencies in user experience and presentation is enough to put me off from using them. For example, the visualisation bundle permits users to make poor design choices:
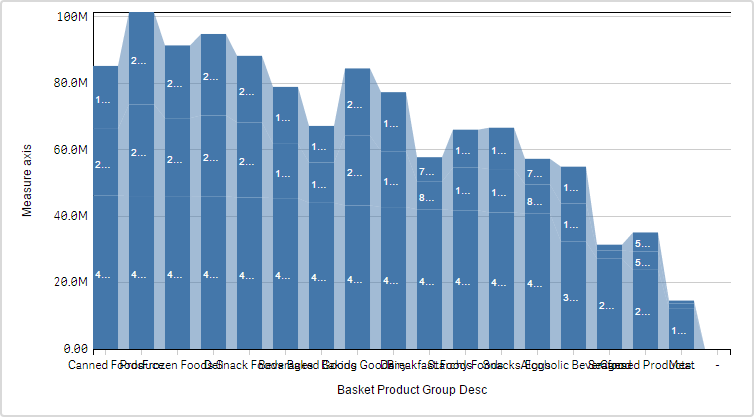
Can you count how many mistakes are present immediately after adding the data to the chart?
I guess that’s the compromise when introducing greater flexibility.
Qlik Connectors
There is now support for Enterprise Data Sources in a SaaS (Software as a Service) environment with ODBC Drivers in Qlik Cloud Services and Multi-Cloud environments. Additionally, there is extended connectivity reload capabilities with Basis Scheduled reloads for Enterprise SaaS.
Associative insights
The most impressive feature in the Qlik Sense April 2019 release has to be Qlik’s Associative Insights. Driven by the Qlik Cognitive Engine and Qlik Associative Engine, the synergies are outstanding. Located in the Selections Tool, the Qlik Associative Insights will promote data literacy by helping users discover and understand what is in the ‘grey’ (excluded values). This will enable users to extract the full value from the Qlik Associative Engine and more importantly their data – further increasing the potential ROI.
To explore the Associative Insights, click on the selections tool ![]() followed by Explore selections
followed by Explore selections ![]()
As you might have guessed, this will reveal insights into the excluded values, so be sure to make some selections first! Once you’ve made selections click Generate Insights.
Qlik’s Associative Insights will base its findings on a particular measure:
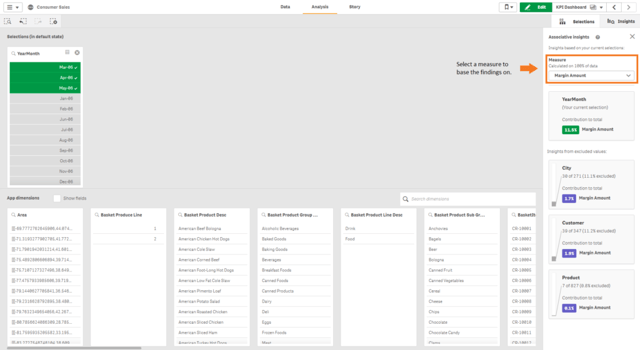
By default it will provide insights founded on your master dimensions. To enable insights on fields you need to select ‘Show fields’. The cards along the right-hand side show some insights related to your selections:
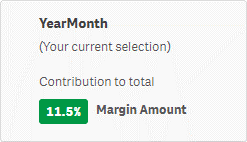
Followed by insights from excluded values:
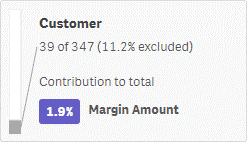
We can click on these cards to learn more.
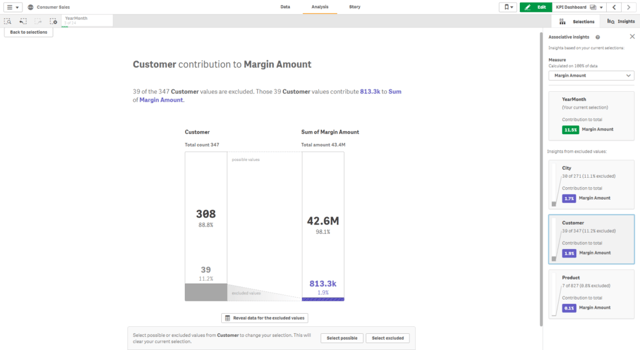
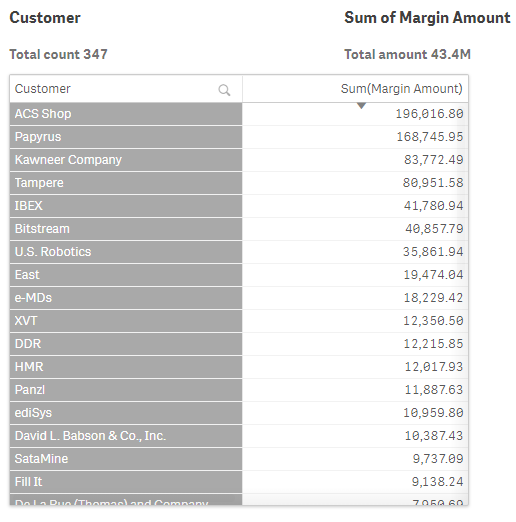
Here the Associative Insights informs us that 39 of 347 customers, representing £813k margin for the entire data set, have not placed an order during the time period selected. We can view those customers by clicking on ‘Reveal data for the excluded values’. This will show a table of excluded customers (customers who haven’t bought anything) based on our selections and an expression based on the measure selected at the beginning.
 Now we know what has, and has not, happened, we can start looking into why by selecting the excluded values using the buttons at the bottom of the page. From here, we can go back to our visualisations or the Insights Advisor and use natural language to fully understand what’s happening:
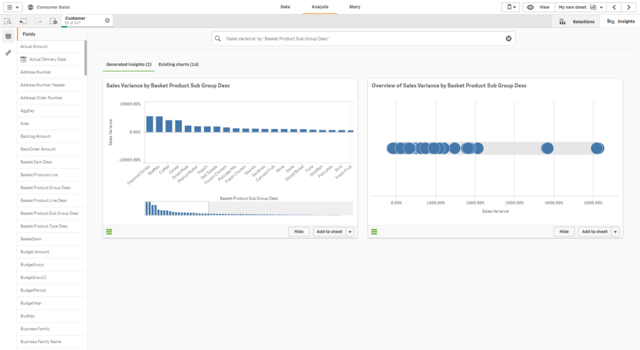
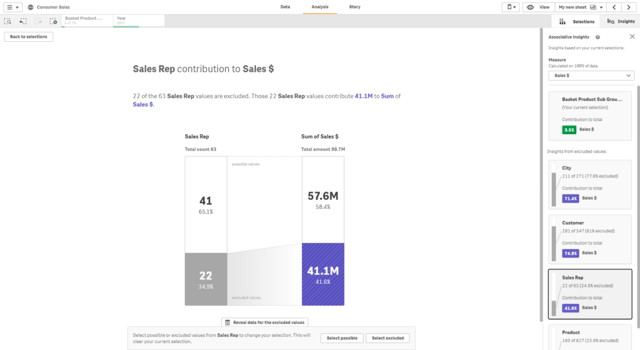
If we expand the bar chart, we can see some products have had negative sales growth. If we start our second iteration of associative insights, and explore our selections of those products for the latest year, we can see that roughly one third of our sales representatives have not sold those products this year.
For the year prior it was only four sales representatives!
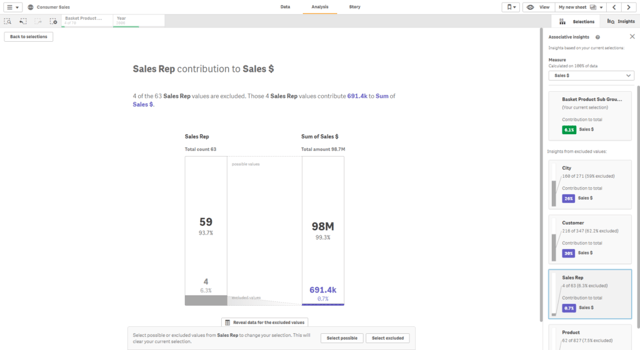
It is at the point of understanding the cause that users can take action. In this example, margin dipped due to a third of sales reps not selling a group of products.
To summarise, the Qlik Sense April 2019 release is filled with lots of enhancements, both to functionality and to the workflow. I am confident we will see improved efficiency as a direct result. With the introduction of Associative Insights we’ve also been treated to some great innovation which will drive action and evidently provide quicker return on investments for Qlik customers.
Remember to hit the follow button and keep an eye out for our content on Twitter, LinkedIn and YouTube.
By Chris Lofthouse


Comments