

Qlik Sense September 2018 Release is out already. While most have been on vacation over the last 10 weeks, since Qlik Sense June 2018, Qlik have been relentlessly working to provide improved usability and functionality.
In this release we have ten improvements, three new pieces of functionality and one acquisition!
While Qlik have matched the amount of additions since the last release, they have clearly focused on closing off some gap functionality between Qlik Sense and QlikView. Addressing some design inconsistencies and improved the Cognitive Engine – with positive progress made with the Insights Advisor.
September 2018’s improvements are:
Interaction on hybrid devices
When using a hybrid device, such as a Microsoft Surface Book/Pro, Qlik Sense will automatically enable touch-mode, which presents itself differently. For example, it assumes touch devices don’t have a mouse and therefore the hover-over options become part of the menu when you right-click, or long-touch:
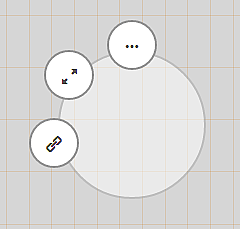
This can become confusing and frustrating when the device is docked with a keyboard and mouse. Qlik have acknowledged this and users can now disable the functionality. To enable/disable, click on the Menu icon, located in the top-left-hand corner of the main toolbar within an app, and click on the Touch screen mode toggle:

Expression editor enhancements
Building on the enhancements from June 2018’s release, Qlik have improved the categorisation of functions. For example, a new ‘Table and Field Functions’ category now exists, grouping functions such as ‘Column’ and ‘GetCurrentSelections’. While these functions existed before, it makes them easier to find which is useful for new Qlik users.
Another improvement worth highlighting is the search capabilities on all drop-downs in the expression editor. Despite being a small change, it makes the experience of working with the expression editor more natural – searching for specific fields and sifting through the hundreds of functions will now be easier.
Those who need further help, or a refresher on a particular function, can now benefit from the help mode by clicking the question mark located in the top-right-corner of the expression editor. Help mode makes all functions clickable.
![]()
On-click, the user will be navigated to the functions’ page on the help site. This functionality already exists in the Data Load Editor, so it’s nice to see it make its way to the front-end. It’s interesting to note that a shortcut for this already existed in previous versions, where by pressing CTRL + H immediately after the function would achieve the same goal.
Hide and show columns in a pivot table
In the Qlik Sense June 2018 release, we saw hide and show columns in a straight table and now it’s available for pivot tables too, using expression conditions which is consistent with the straight table object. Again, hiding columns until the user has filtered the data is a useful technique of controlling when a calculation should be performed, particularly if you have large amounts of data or resource-extensive expressions.
Map improvements
Recently, I was asked about how to label the size and colour measures in the map component by a customer. I had to suggest using a master item. While this is best practice, it can slow the development process down when you just want to quickly visualise some data. Thankfully, you can now label both ‘size’ and ‘colour’ labels in the native map component.
Other improvements to the map visualisation include:
– Adaptive pixel zoom and pan to optimise performance when browsing dense maps.
– Default colours for added layers. Each new layer has an independent colour picked from palette. I did try testing this and it doesn’t appear to be working for me – potential bug, maybe?
– And, KML files with geographic line data can now be loaded and rendered.
QMC updates (move multiple published apps between streams)
Back in the April 2018 release, Qlik introduced the ability to move a published app between streams from the Hub. Remarkably, this functionality was not added to the QMC at the same time and has only now made its way into the QMC.
![]()
The benefit of being able to move apps from the QMC is that you could move multiple apps with a single click, they don’t even have to reside in the same initial stream.
AirWatch EMM now supported for Mobile devices
Access to Qlik Sense Enterprise is now supported in AirWatch EMM (Enterprise Mobile Management) environments using Safari, Chrome or VMware browsers.
Angular front-end framework upgraded to version 1.6.9
This impacts only those extensions that use Qlik’s angular dependency, where the library has been upgraded from version 1.5.8 to 1.6.9. Remember to check all extensions you have imported are compatible before upgrading your Qlik site.
Insight Advisor
My fondness for the Insight Advisor grows by release. I did some initial tests with the June release and it was pretty impressive. I’d recommend reading my last post before continuing as I’m about to refer back it. I’ll summarise for those who just want to carry on.
Once data has been loaded into an application Qlik’s Insights advisor will automatically generate visualisations based on insights it identifies, but still allowing users to focus Qlik on specific fields, dimensions and/or measures. Interestingly, it didn’t offer certain visualisations types and did favour certain data types, such as sales or financial data.
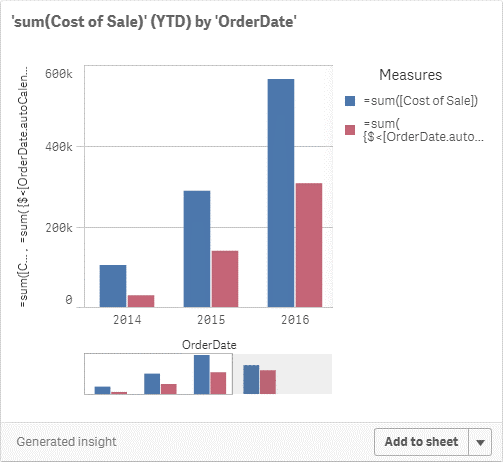
In September 2018 it’s much improved. Looking at the same data set, we can notice the differences. Firstly, we have one additional insight – a pivot table presenting the persons responsible for the highest Cost of Sale per country and employee; using the FirstSortedValue function. Not bad for a single click.
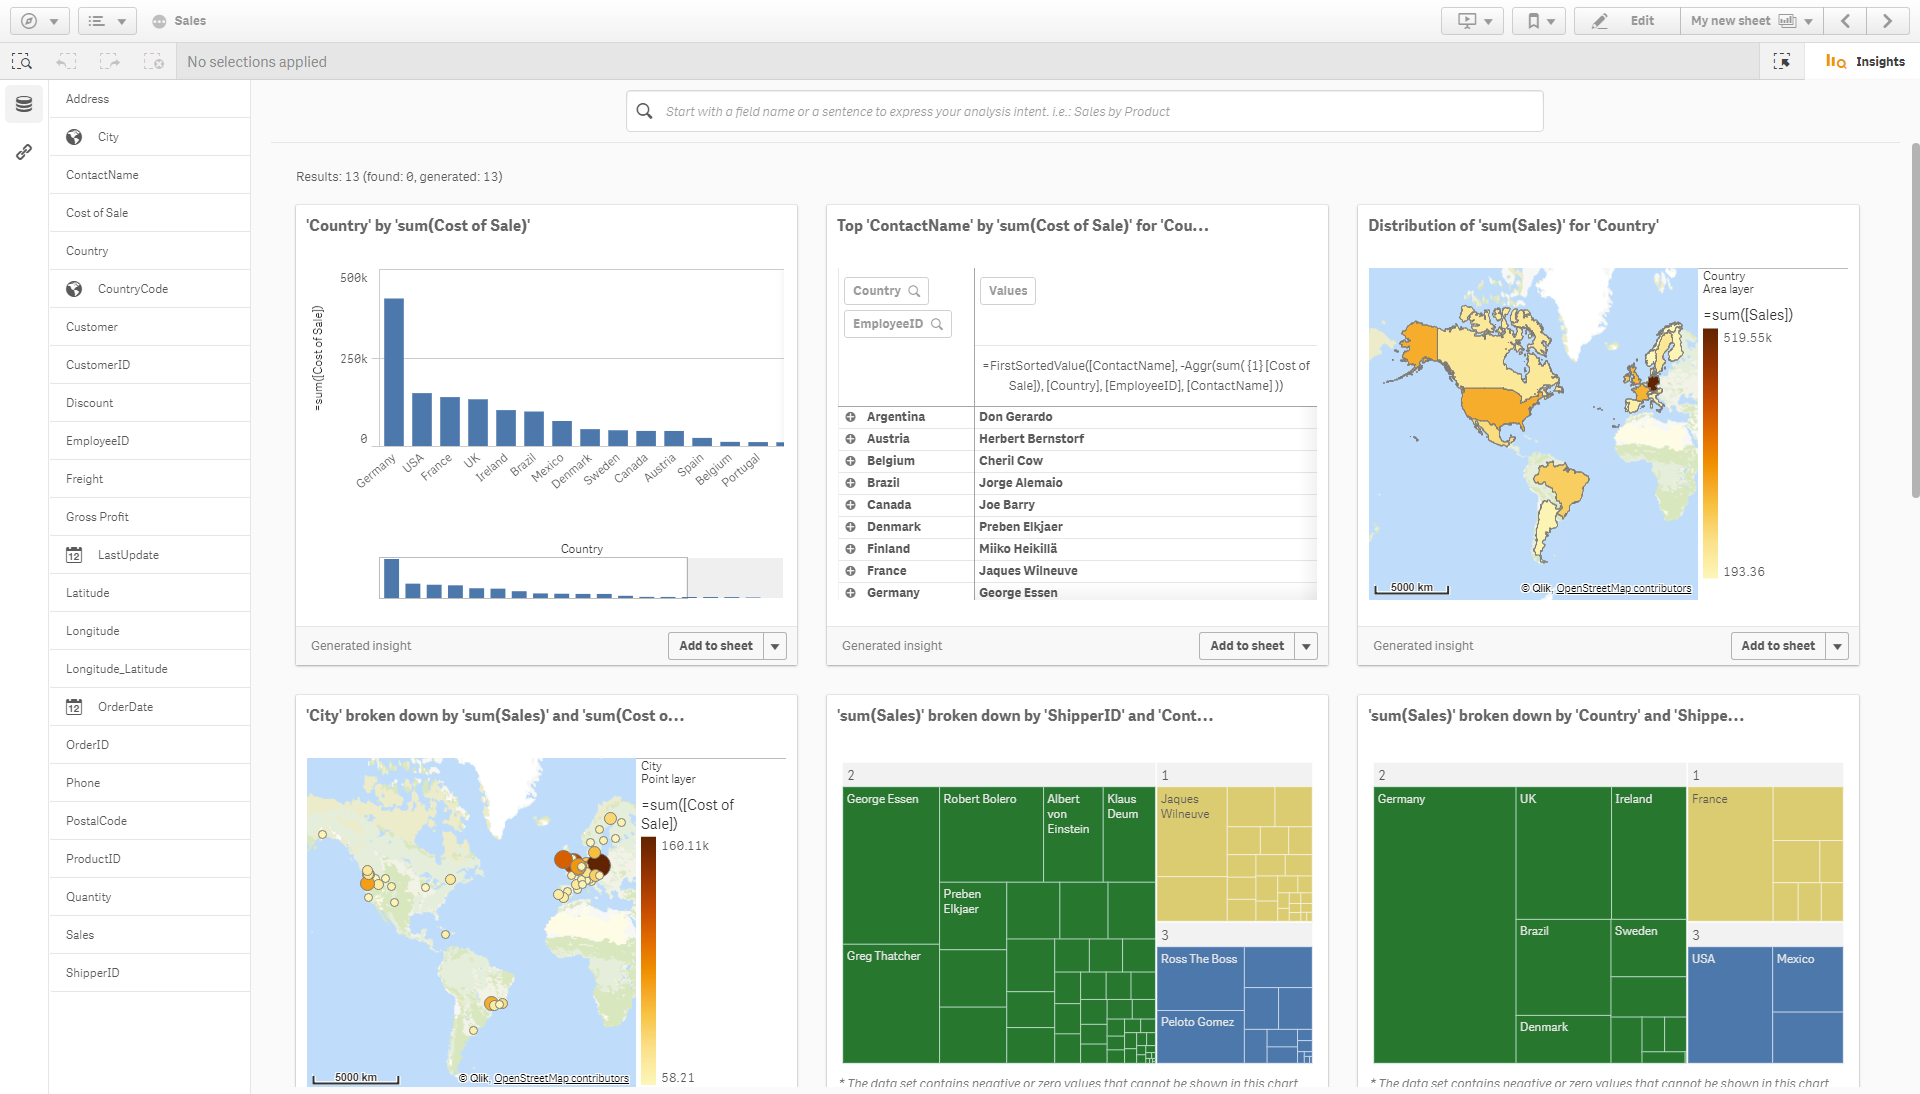
It’s also showing more insights into a single view, with three columns instead of two.
One of my previous complaints was that it didn’t provide commonly used visualisations, such as tables and KPI’s. Well, I’ve been corrected – with all possible visualisations presented appropriately… very nice!
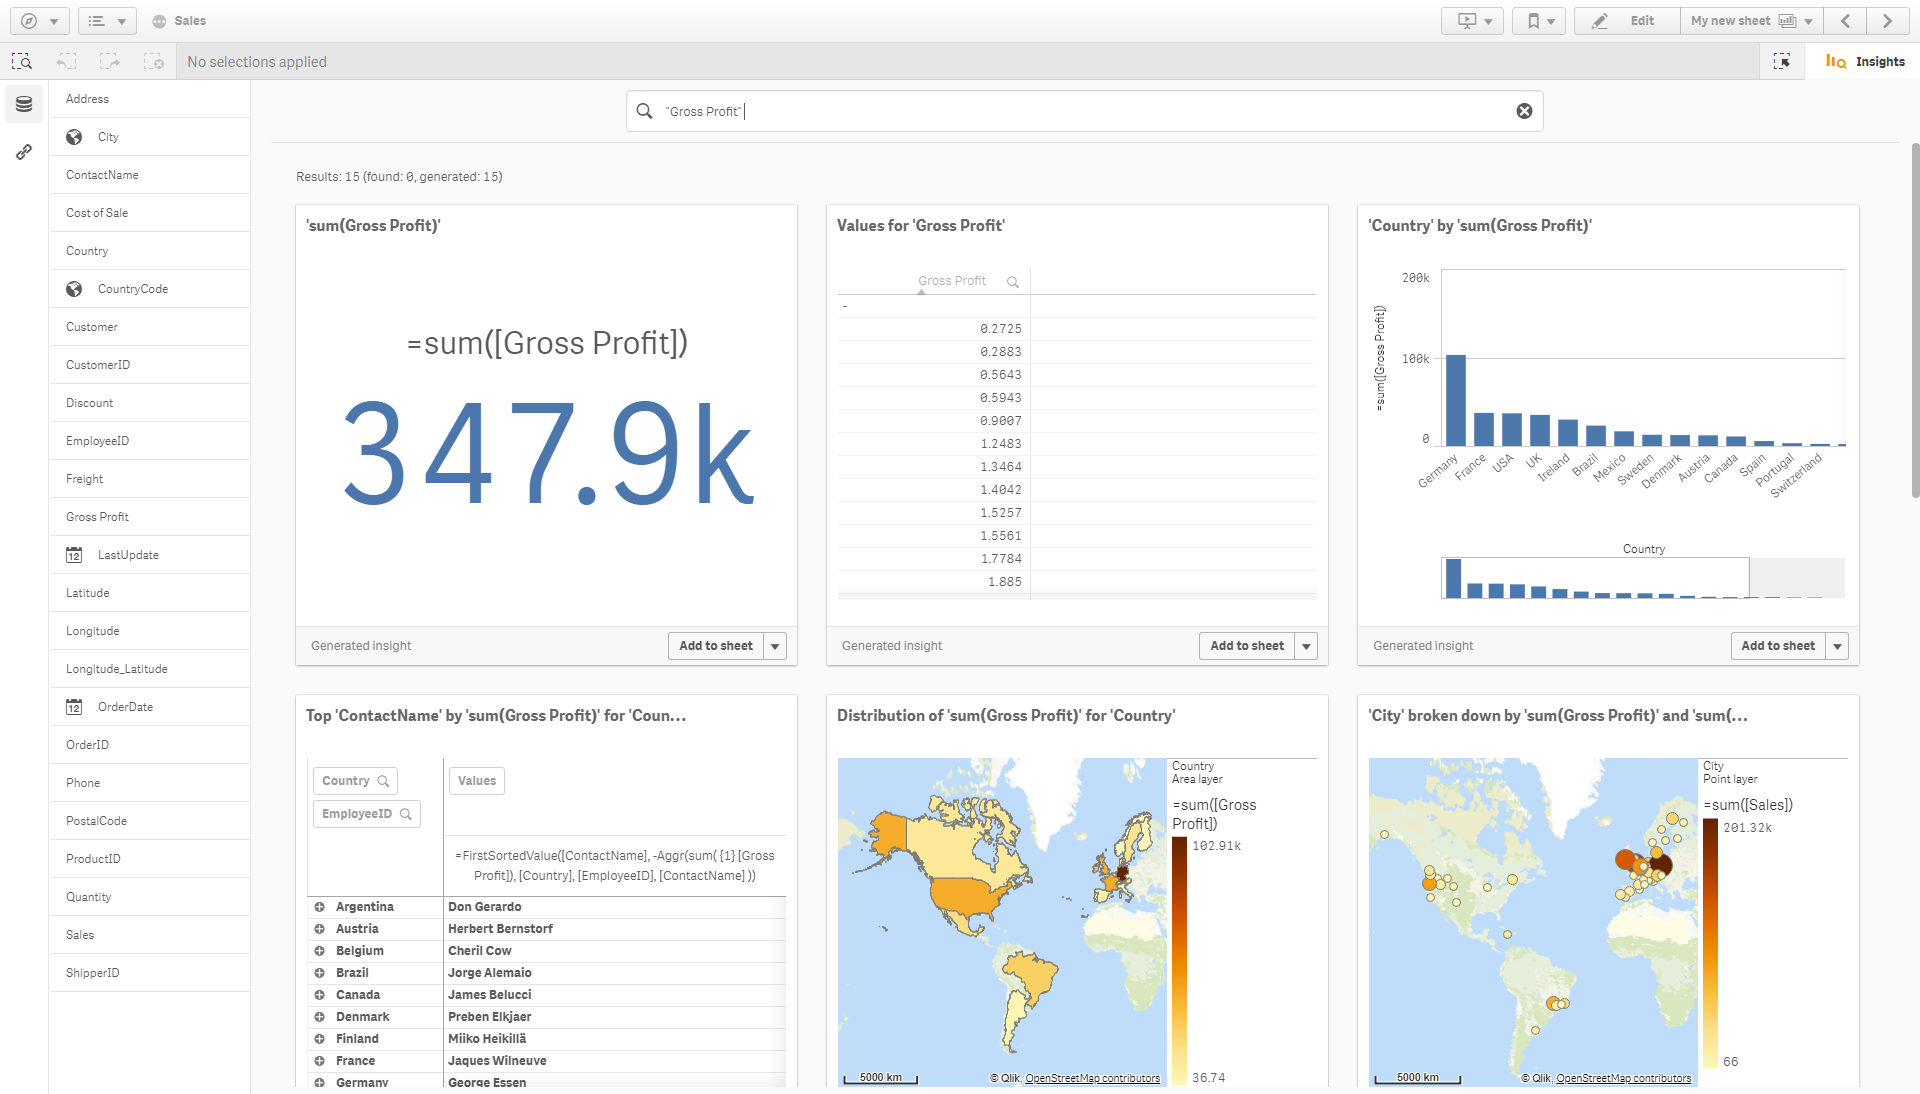
It’s interesting to note that it also appears to be offering more time-based visualisations too, comparing years for example. This leads me to think it’s become more intelligent.
One last thing worth noting is that it’s now available for all users. Previously, for some bizarre reason, it was restricted to non-published applications. It can now be accessed in published apps, however it has a restricted view of only the master items – and quite rightly, to ensure users only use governed metrics. This then makes for another reason why developers should create and maintain both, master measures AND master dimensions.
Something I failed to mention in my last release blog was that visualisations no longer appear in the Smart search, this now seems to be specifically for making selections over multiple fields. Therefore, I can’t help but feel that the smart search and selections tool are effectively tasked to do the same job, just in different ways. So why not merge the two into a single view?!
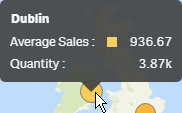
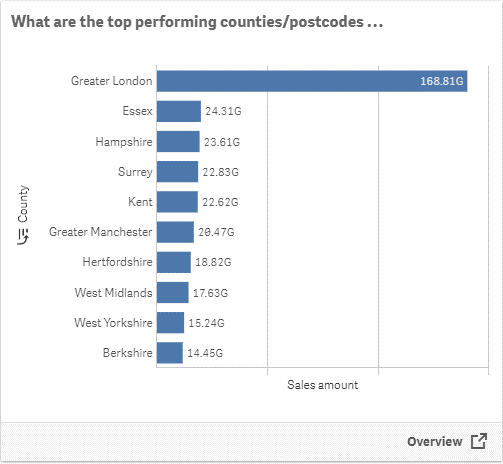
If you, or your users, used the Smart search to find visualisations, you should now use the Insights advisor. If the object already exists, based on the fields/measures you select, or search for, it will appear with a link to the sheet as shown below:
Disable responsive layout
To me, one of the major selling points of Qlik Sense, over QlikView, is the responsive layout – the ability to design a dashboard once and knowing Qlik Sense will automatically adjust the dashboard, and it’s components to match the users screen.
Surprisingly, it is now possible to disable responsive layout – achieved through the sheet properties. This may appear like an unusual addition to some, as it was one of the pains of QlikView. However earlier this year, at Qonnections, there was some discussion around Advanced authoring. Which, if I’m honest, sounded like embedding QlikView into Qlik Sense. During this open-mic session, it was mentioned that they were struggling with the quality of exported images, sheets and stories because of the responsive layout. I’m guessing that this may be one of the reasons behind the addition of fixed resolutions.
Therefore, in due course, I imagine we will see an improvement in the quality of exported imagery. One of the major benefiters could be NPrinting. This could potentially allow developers to preview the results of visualisations without having to run the report countless times to test the output.
If we are looking far enough into the future, could I be as bold to say this could be the start of NPrinting transitioning into the Hub?! Of course, we are not close to that point yet, given that even with custom resolution enabled, sheets are still exported with responsive layout. Also, this feature is not yet supported on mobile device and nor does it support the extend sheet capability.
Regardless, this is one of the key changes I will personally be tracking in the future.
Qlik connectors
We have three updates to Qlik connectors:
– Native connectivity added to MS Azure QSL DB, with tested and supported integration.
– The JIRA connector is released to GA from beta.
– Enhanced security for LDAP authentication, which is built into the Qlik ODBC Connector.
New Pieces of Functionality
Default bookmarks
Some gap functionality from QlikView, which is commonly requested by our customers, is applying a default selection upon opening an app. This void has now been filled but being able to default to a specific sheet usually coincides with that request and this is still not possible out-the-box.
There are a few points to mention, firstly you can only apply one default bookmark per app and it can only be set and removed when the app is unpublished. Secondly, the default bookmark persists into any duplicated versions of the app. Thirdly, users can override the default bookmark, but the default bookmark is reapplied when a sheet is re-opened or when you refresh the window in your browser. Therefore, if you open a second instance of an application, as normal behaviour states, the selections will be synchronised between the browser tabs.
Having said that, as I learned the other week, it is possible to have two separate selections states open for the same application. This prevents the default synchronisation behaviour. Read about setting alternate states (state identity) here.
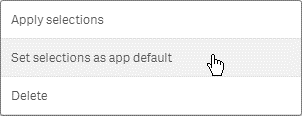
To apply a default bookmark, right-click on a bookmark and select ‘Set selections as app default’ – easy!
Someone commented on the technical preview bulletin about using an evaluated value to calculate and apply the current year, as an example. This is not possible yet, but you can use flags or create time-based descriptions to make those selections for you. In fact, I’ve been working on a time-aware calendar script generator which does this for you, go over to the Ometis Toolkit to check it out.
You can watch me walk through the new Default Bookmark in my vlog.
Master measure colour scales/gradients
This is a great new feature. Qlik have introduced ‘Segment colors’ for master measures. This provides the user will the ability to create a custom gradient for a specific measure, based on fixed values or the percentage of the total value.
The user can select a template to start, change the segment colours, size of the limits, and can choose to add or remove limits altogether.
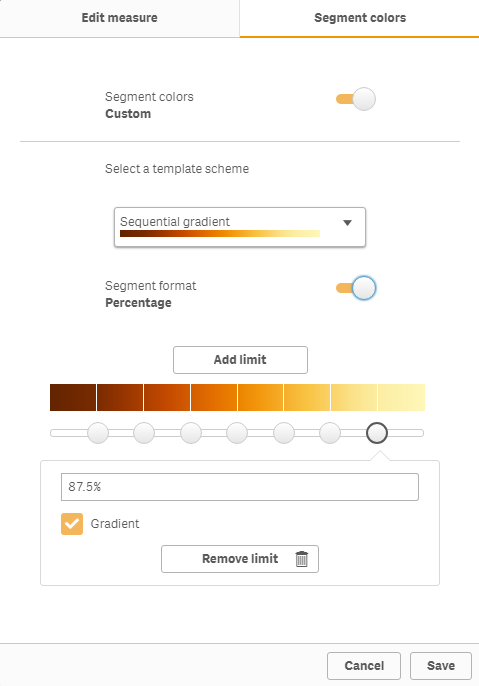
What’s great about this feature is that it is compatible with custom themes and the template selector will show you those gradients specified in the theme. Also, once you’ve created a Segment Color, it appears as a recently used option so you don’t have to start from scratch.
![]()
This feature is useful when you have extreme outliers that make all but a few values one colour, so thanks Qlik. I will point out though, applying ‘segment colours’ is slightly inconsistent to applying ‘dimension value colours’. When you select colour by dimension, the library colours option is enabled by default. This is not the case when you select colour by measure, when you have to enable library colours after. However, that is me nit-picking on what is a great new addition.
You can watch me walk through the new Segment Color functionality in my vlog.
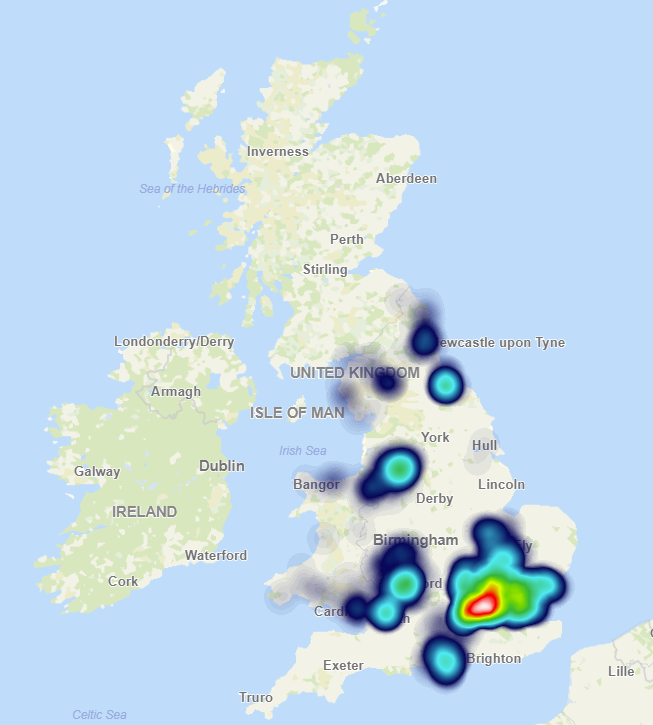
New density map layer
This is the latest layer addition to the native mapping component – the density layer, aka the heatmap. This is a multi-colour gradient map layer where colour intensity depends on the value and closeness of points. Perfect for showing hotspots in your data.
This almost completes the transition of the layers, from the GeoAnalytics mapping component, into the Native Map component. The only layers left are the animator and chart layer, with some additional nice-to-have properties, such as custom tooltips – allowing developers to embed Qlik Sense objects, text and other metrics into the tooltip.
You can watch me walk through the new Density Map Layer in my vlog.
Podium Data Acquisition
On July 24th, Qlik acquired Podium Data. This is a big move for Qlik, who stated their motives are to provide a complete end-to-end solution. While Qlik currently offers a comprehensive platform for performing complex data transformations, this will take the platform to the next level. The additional functionality Podium Data brings includes advanced profiling with intelligent data identification, advanced script-less ETL interface, data curation and data publishing. You can read more on my thoughts of Qlik’s acquisition of Podium Data.
At Qonnections 2018, the tag line was ‘Disrupt everything’ and this certainly has. The size of the disruption will be dictated by the pace and approach in which this technology is integrated into the core platform. Looking back, it took almost a year for Qlik’s acquisition of Idevio, in January 2017, to truly start its transition into the core product while NPrinting, which was acquired three years’ ago, still hasn’t gained true integration status.
Conclusion
In summary, the Cognitive Engine has further improved, with the Insights Advisor working much more intelligently, even with less generic data sets (non-sales/financial data) which it struggled with before. I look forward to seeing this progress even more. After the landmark June release, which typically contains the ‘wow’ features of the year, it’s nice to see Qlik are still invested in delivering quality releases with plenty to talk about.
By Christopher Lofthouse


Comments