

Although Summer is drawing to a close, Qlik keeps on shining with its latest release – Qlik Sense September 2019. There are some big wins for time-savings when developing in Qlik Sense, and some nice improvements across the board. Let’s take a look…
Qlik Sense September 2019 Highlights Video
Improvements in Qlik Sense September 2019
Increased search limit on filter panes
Previously, filter panes had a limit of 255 characters. This has been increased to 5,000 characters – enabling users to enter more values for bulk selection.
Insight Advisor
Qlik’s Insight Advisor, the precedent-based learning service, which provides an entry point for exploring data and creating visualisations has seen some useful improvements. Firstly, as you can see in the screenshot below, an Insights properties panel has been added. This enables users to understand the makeup of an insight that it generates.
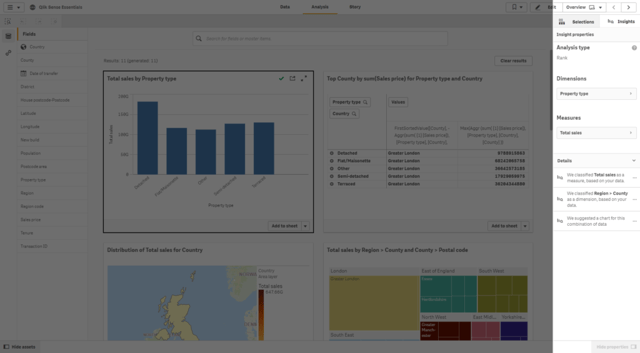
At the top of the properties panel you have the Analysis type it has determined is best, based on the data, dimensions and measures. Similar to the properties panel of a visualisation created in a sheet, the user can customise the dimensions and measures that it uses, and the Insight Advisor will learn from it. If you do make a change a notification will appear, prompting the user to inform the Insights Advisor to do just that – Learn.

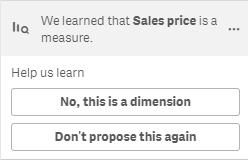
Below the Data section of the properties panel is the Details section. This breaks down how it made its decision to generate the insight. Should any of these details be completely wrong, unsuitable or uninteresting, the user can help the Insight Advisor learn further by expanding the individual detail and clicking “Don’t propose this again”. Alternatively, the Insight Advisor has incorrectly classified a field as a dimension, instead of a measure, or vice-versa, you can correct it.
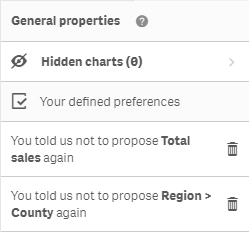
Once a user has fed back some suggestions, they will be prompted to refresh the results. Qlik will then generate new insights based on these learnings. If, at any point, the user wants to undo or re-educate the Insight Advisor, they have quick access to their defined preferences, where they can delete their precedents or show hidden charts.
As far as I can tell, these precedents are at a user level. Meaning each user can define their own personal precedents that have greater weighting than what Qlik has learned from interactions from others – and it does retain those precedents from one session to another, which is very handy.
All-in-all, this is a great stride forward in the capabilities of the Insight Advisor.
Associative Insights
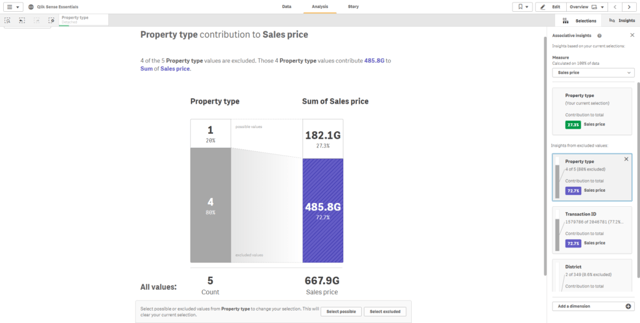
Associative Insights has also had some positive tweaks in the Qlik Sense September 2019 release. From what I can gather these are more performance related improvements. For instance, rather than look at insights across all fields, the Associative Insights now focuses in a select few that offer the most relevant insights, while still allowing users to add dimensions they are interested in exploring the excluded values of.

I stand by my previous statement, this tool really does allow users to shine a light on the ‘grey’ values and lowers the barriers to data literacy.
It also appears you can use numerical fields, in addition to master measures, which is useful when you want to explore unassociated values quickly on a new data set.
Mobile updates:
- Users can now use Qlik Sense within a MobileIron environment using Web@work, Safari and Chrome browsers, expanding access within secure MDM environments.
- Qlik Sense Mobile now supports the new iPadOS. Please note that this is dependent on the timing of the iPadOS release.
New functionality in Qlik Sense September 2019
Current location
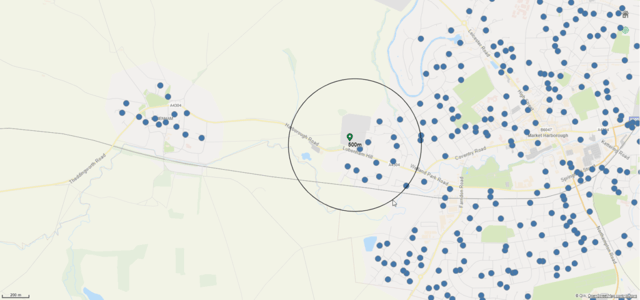
The map chart now comes with the ability to fetch and plot a user’s current location via the browser. Providing Location Finder has been enabled under the Presentation Panel of the map chart properties a small cross-hair icon will appear in the top-right:
![]()
Click this and users will initially be prompted to allow Qlik to use the browsers’ location function. This will allow Qlik to plot the users’ current location on the map, alongside the existing layers. Using the location finder in combination with the Circle selection will enable users to perform a location-based search on their current location – particularly useful for Qlik Sense mobile users.
This is a solid introductory capability to the map chart, which appears to be a key priority for Qlik as it continues to push for a more advanced GeoAnalytics offering. However, I think the expectation of most users is a Google Maps type capability, performing on-the-fly distance and/or drive-time analytics based on their current, or defined, location.
Default landing sheets
All the way back in September 2018, Qlik introduced default bookmarks into Qlik Sense. A whole year later they have added a small alternative capability to this – default landing sheets.
Much in the same way as you would create a default bookmark, in an unpublished app, navigate to the sheet the user should enter the Qlik Sense application on. From here, create a bookmark, with or without selections, and set it to the default (by right-click on the bookmark). Bingo! Now, when a user enters the app they skip the App overview and dive straight into the analysing a sheet. Simple, yet effective. That’s one less decision the user has to make, which is always a good thing to me.
Master item promotion
One of the most impactful additions is the ability to promote measures and dimension to master items. These will speed up development significantly, specifically when creating and using master measures and dimensions. The Add New Master item buttons appear beneath each local dimension and measure in the Data Panel of an objects properties.

Clicking the master item promotion button will quickly elevate a rogue expression into the master item library. There are two useful benefits from this, the obvious being the creation of your master dimensions/measures, which in-turn builds out your master library, enabling developers, and users, to build, maintain and reuse a single version of an expression, ultimately improving data governance.
The second benefit being that the expression or dimension is automatically changed to the master item that is created. Previously, I would create the expression in a chart, test it, and then copy it out and create a master measure, then replace the original expression with the master measure, and subsequently losing the number formatting. Well, no more, although why can we still not save a default number format for a master measure? In any case, this is yet another simple addition but comes with a huge time-saving and promotes best practice at the same time. This is truly fantastic, thank you Qlik. I’d upgrade based on this addition alone!
Join operators in the Data Manager
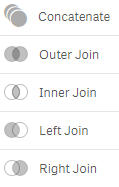
The Data Manager in Qlik Sense September 2019 now lets users to join data sets, in addition to concatenate. The additional ability to perform an Outer, Inner, Left and Right Join makes it extremely easy to join two tables of data together.
Just like using the existing Concatenate operation, users are given a visual, drag and drop, experience for mapping fields and previewing data values which is great.
My only critique, and this isn’t just Qlik but all data preparation tools I’ve seen, is that while using the functionality is made easy, understanding what it does is less clear to the average user. This lack of understanding can be dangerous. For example, without warning, it is now possible for a Qlik user to use the join operator without any common fields (in the Data Manager, this is when no fields are mapped together in the Join or Concatenate operation). Known as a Cartesian product; every row from the primary table being joined to every row in the secondary table, this can literally bring an entire Qlik site to grinding halt. So, while this is a ‘step forward’, a fully-guided experience is truly required for complex data operations, such as Joins. Being able to convey and preview the impact of an operation instantly would make this widely user-friendly.
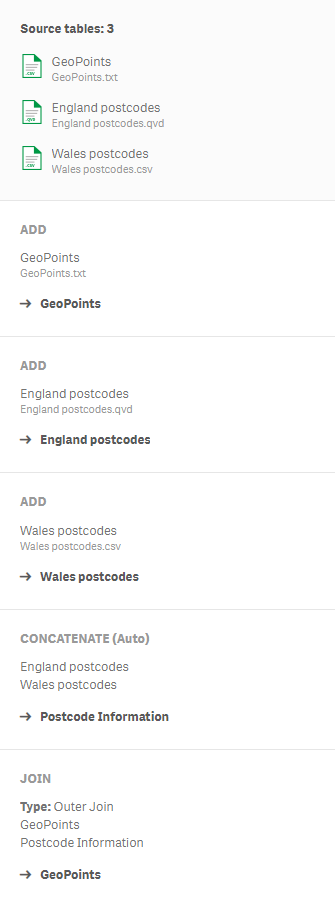
Having said that, the data lineage provided in the Details View is coming along nicely. Provided some useful insights into the transformations of the data, and their sources. Hopefully, Qlik will add some statistics in there in the near future too, such as number of records, record variance due to operations, reload time per operation, etc.
Variance waterfall chart
The variance waterfall chart is the newest visualisation in Qlik’s visualisation bundle. The variance waterfall chart provides variance analysis between two measures, and aggregated over a dimensional values.
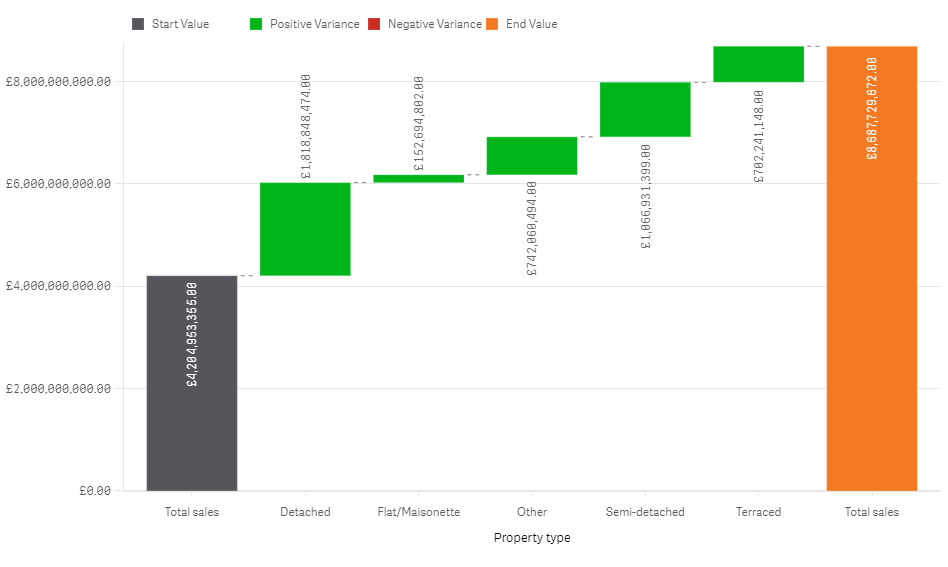
To be short, this is everything the native waterfall chart should have been, and I hope it gets added into the native chart library soon. It just works perfectly. In the example above, I’ve used set analysis to limit total sales up to the previous year for the starting value and the end value includes all sales, with no limitation, all that was left was to pick which dimension I wanted to aggregate over.
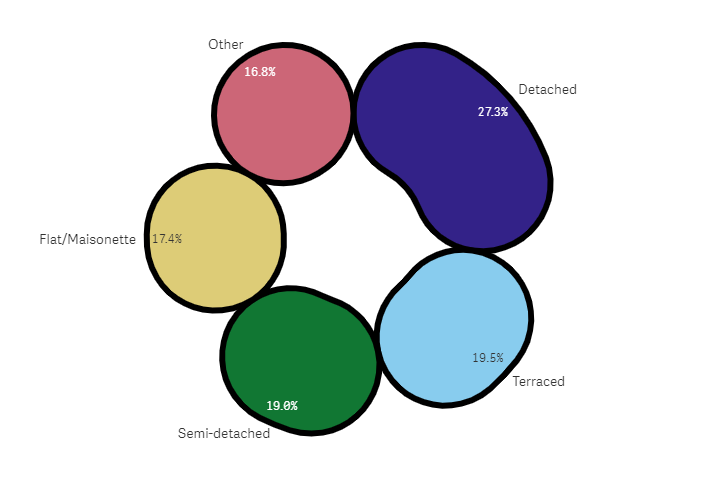
Pie chart styling
The last addition I’ll talk about in the Qlik Sense September 2019 release is the advanced styling options in the pie chart, which take after those in the bar chart in the June 2019 release. Now, although pies should only be used for eating and not visualising, here are the four additional options you have in your toolkit:
- Outline width.
- Outline colour.
- Corner radius.
- Inner radius.
All this means is that you can produce something that looks like this:
And, we’ll leave it there!
Qlik Sense September 2019 Summary
Qlik have provided a solid release in September 2019, worthy of an upgrade. With functionality such as master item promotion, well-thought out improvements for further feeding back to the Insights Advisor and the much-needed variance waterfall chart, it’s hard to be gloomy that Summer has ended.
And, while you are here, be sure to checkout the Qlik NPrinting September 2019 release blog as it’s got a big addition too.
If you want to chat further about the Qlik Sense September 2019 why not find us on LinkedIn, Twitter or YouTube? Alternatively, feel free to contacts us directly.
By Chris Lofthouse
Follow @clofthouse89


Comments