

Extended reporting and visualisation options are the highlight of the Qlik Cloud November and December 2022 releases. Mats Severin summarises these and several other updates that were added to the platform at the end of 2022.
Qlik Cloud Reporting with PowerPoint
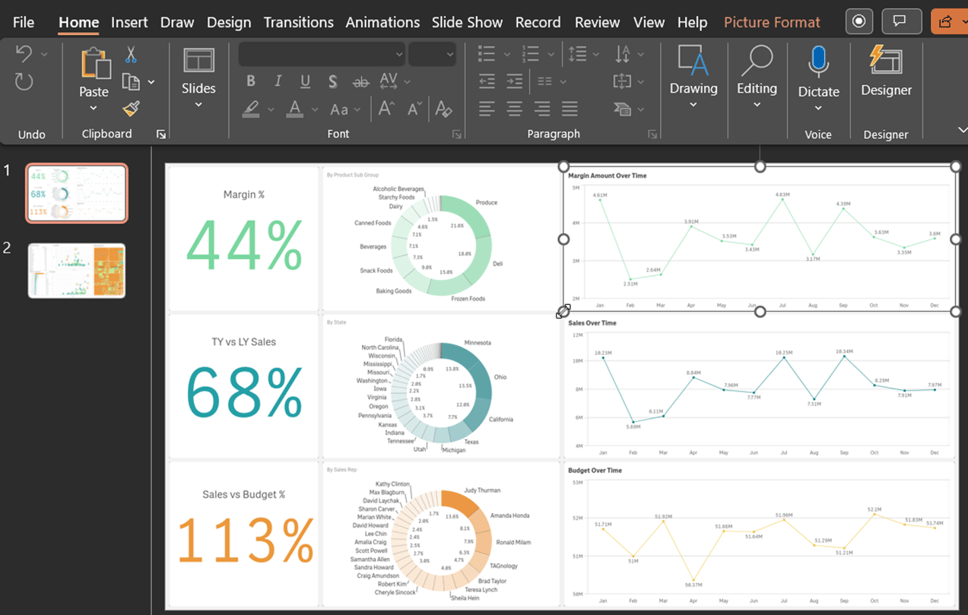
Qlik Cloud Reporting services now support PowerPoint output for reports. Both subscriptions and Qlik Application Automation reports can be generated in PowerPoint. This means that the reports are now editable after generation. Once in PowerPoint, the visualisations can be resized as individual images and additional styling can be applied. The latest updates to styling of sheets and visualisations in Qlik Cloud include background colours, various fonts and the custom grid size. This gives app developers more possibilities for advanced formatting before exporting the sheet to PowerPoint.
Visualisations updates
Styling updates to several visualisations
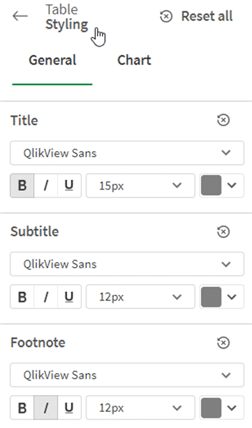
Users can now style the font used for titles, subtitles, and footnotes in tables, pivot tables, waterfall charts, histograms, distribution plots, box plots, gauges, and KPI charts. All these visualisations, except tables and pivot tables, can now also have a custom background colour or background image applied to them. The new General tab provides options to change the font styling and background. The Chart tab controls styling of rows, scrollbars, and custom headers. Both tabs can be found in the Properties panel, under the section Presentation > Styling.
Turn chart animations on or off
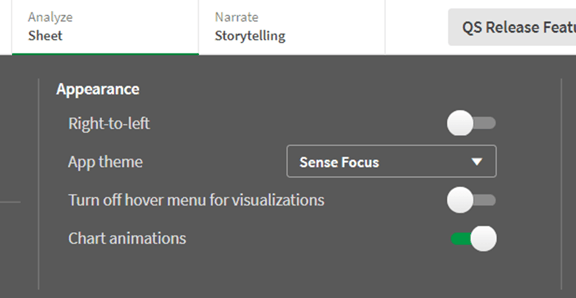
Chart animations are the gradual transitions in a visualisation from the old state to the new state after a selection has been made in the visualisation. Animations can be turned on or off in app settings. Animations can be enabled in the following chart types: bar charts, pie charts, scatter plots, funnel charts, grid charts and sankey charts.
Platform, Admin and App Development updates
Manage load scripts history in Data load editor
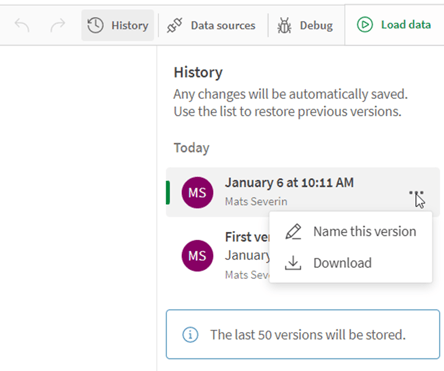
The new history panel allows app developers to save and commit different versions of the load script. Selecting previous versions allows you to preview and restore older versions.
Improved performance when downloading sheets and charts
The chart and sheet download preview dialog has been updated. Download data (to an Excel file) is now the first option, rather than download as image. This means that if you do not want to use the download as image option, you now don’t have to wait for the image preview to load.
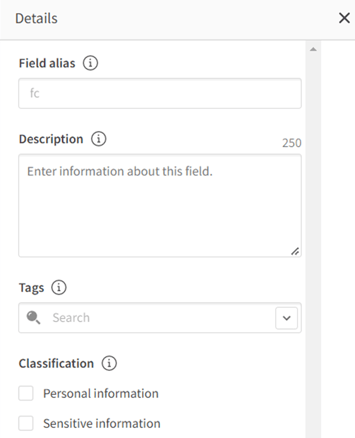
Managing field-level metadata
Field profiling allows users to view and visualise field profile metrics at a glance, without needing to create an app first. Field-level metadata lets users edit metadata fields including Field Alias, Description, Tags and Classification. The feature is available in the Fields tab when clicking into a dataset in the hub.
Improvements to makeweekdate script and chart function
The makeweekdate function can now use the FirstWeekDay, BrokenWeeks, and ReferenceDay system variables. The function also supports new parameters (first_week_day, broken_weeks, and reference_day) which can be used to override corresponding system variables.
New notification options for administrators
Tenant and Analytic Admins can now receive notifications at the global tenant level for apps that fail to reload. If notifications have been used in the past, you will need to resubscribe.
Improved user management in the Management Console
In the User section of the Management Console, admins can now see roles from groups in the Roles column, whereas the User ID, IdP subject and Invite expiry columns have been removed. The invite expiry date can be viewed by hovering over pending invites in the Status column.
Upload Qlik Sense Visualisation Files (.qvf) from QlikView to Qlik Cloud
Qlik Sense Visualisation Files (.qvf) files created in QlikView can now be manually uploaded into Qlik Cloud. Previously, only QlikView Worksheet (.qvw) files could be uploaded.
New connectors and templates in Application Automation
Two new connectors and four new templates have been added to Application Automation:
New Connectors
- Microsoft Outlook: allows users to link their email accounts and send emails. Emails can have attachments and be formatted using HTML.
- Apache Kafka: allows users to publish data sourced from any of the supported Application Automation connectors into Kafka topics and streams via a Confluent Rest Proxy.
New templates
- Export audit trail logs from QEM to Splunk: enables users to incrementally export audit trail logs from Qlik Enterprise Manager to Splunk. Additionally, users can change the template and export the audit trail data to other logging platforms.
- Create a Slack channel when Jira tickets update: automatically creates a new Slack channel, invites the members, and sends a message to the channel along with the Jira ticket information, every time there is a status change to a Jira ticket.
- Split QVDs using an automation to improve reloads: improves the loading times of application reloads by splitting a large QVD file into several smaller ones.
- App evaluation: evaluation on a Qlik Sense app to determine if the app should be published or not depending on slow cached objects.
AutoML updates
New feature insights
AutoML has new insights to help clarify what happens when the machine learning algorithms train on a dataset: the underrepresented class insight and the one-hot encoding insight. The underrepresented class insight is when a value in the column has less than ten instances. The one-hot encoding insight is when a categorical feature has less than 14 unique values
Schedule dataset predictions
Dataset predictions can now be scheduled to run on a periodic basis. At each scheduled interval, AutoML reloads the apply data set, runs new predictions, and publishes the output files to the hub to be reloaded into analysis apps.
Receive notifications for AutoML experiments
Notifications can be sent when a machine learning deployment is created, an experiment version is ready, a model has completed training, or a prediction is created.
Connectivity updates
Direct Query now supports Google BigQuery
Users can now connect to Google BigQuery databases using Direct Query. Direct Query allows analytics applications to directly query cloud databases with SQL pushdown as users filter the app. Especially, for big-data analysis or near real-time scenarios Direct Query is very useful.
Direct Query now supports searching in listboxes
When using Direct Query in a listbox, you can now type in search terms instead of scrolling down to find dimensions.
GeoOperations analytics sources wizard
GeoOperations now includes three analytic connections that contain all necessary functions to generate GeoOperations scripts, simplifying the creation of geospatial calculations.
New Amazon S3 connectors with enhanced security
Qlik Cloud has two new connectors: Amazon S3 Metadata V2 and Amazon S3 V2 Web storage provider. These connectors use the Amazon S3 API to access your Amazon S3 metadata and are more secure than the previous versions which used the REST API. New capabilities will only be added to the V2 connectors going forward and at some point in the future the previous Amazon S3 connectors will no longer be supported.
Updated Salesforce connector
The Salesforce connector includes the following updates:
- Support to provide any company-specific My Domain URL to the Salesforce instance
- Support for the Salesforce API up to version 56 (default)
- Option to enter a different Salesforce API version in the connection dialog box
SAP connector package updated
Qlik Cloud has updated the transports for the SAP connectors. Download and install the latest version (8.0.2) to ensure you have access to new SAP functionality dependent on changes in the connector SAP code.
AYLIEN text analysis connector
The AYLIEN text analysis data source is no longer supported in Qlik Cloud. Instead, the AYLIEN News V2 connector can be used.
Support for Unity Catalog in Databricks data connections
Databricks connections now support Unity Catalog, a unified governance solution for data and AI assets.
Qlik Data Integration updates
Landing transformations for Data Movement gateway sources
Landing data assets can be managed and transformed the same way as Storage, Transform, and Data mart data assets. You can create transformations, filter the data and add columns.
Improvements to monitoring details in data tasks
The admin debug process has been improved. Admins can now view the SQL statements that have been executed, along with any error messages, the rows impacted as well as run times for Storage, Transformation and Data Mart tasks.
Exporting and importing data projects
Data projects can now be exported to a JSON file that contains everything required to import and reconstruct the data project. This can be used to move data projects from one tenant to another, or to make backup copies of data projects.
Process type 2 dimensions and preserve change history in data marts
Data Mart tasks can now incrementally process type 2 dimensions and preserve the change history of a slowly changing dimension. It works by storing and managing current and historical data values in the data warehouse over time.
Qlik Sense Mobile SaaS updates
- The mobile table object has improved rendering and performance. New features include row counts, expand/transpose row and the ability to copy cells.
- Updated landscape mode sheet navigation, adding a quick way for users to switch between sheets using native gestures.
- Application chaining is now supported, allowing users to persist filters across multiple apps.
- Optimised KPI objects for full-screen mode.
- Standardised warning messages.
Insight Advisor updates
- Insight Advisor can now perform time series forecasting with the new Trend with forecast analysis type.
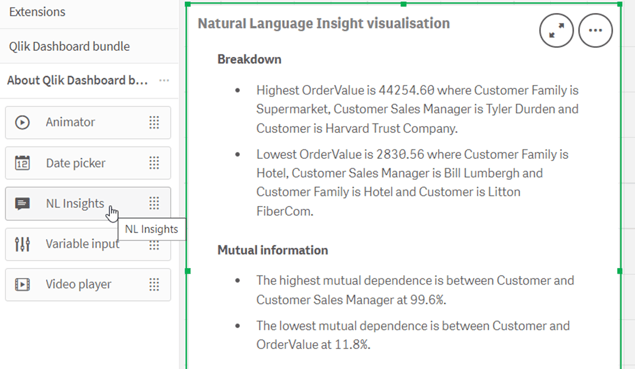
- Natural Language Insights is a new Dashboard bundle control visualisation that displays natural language insights about selected dimensions and measures. This allows app developers to effectively share insights about data with the users. Insights includes analyses based on the data selected.
- Users with the Audit Admin user role can access app usage metrics and user feedback. This allows the Audit Admin to make improvements, either to the app itself or to its business logic, based on how users interact with Insight Advisor.
- Insight Advisor Chat now supports natural language processing in Polish, Dutch and Swedish.
Security updates
Automatic token refresh for connectors
Some Qlik Cloud connectors now automatically refresh the authentication token before expiring. Previously, authentication had to be refreshed manually every 90 days when the token expired. The following connectors support automatic token refresh: Azure Storage, Azure Storage Metadata, Office 365 SharePoint, Office 365 SharePoint Metadata, OneDrive, OneDrive Metadata, Microsoft Dynamics CRM, Outlook 365.
Machine-to-Machine (M2M) enabled OAuth clients
Admins can now embed Qlik Cloud into their web portals and embedded applications using the web standard OAuth2 authorisation. Machine-to-Machine (M2M) enabled OAuth clients are a secure way to manage and automate operations on a Qlik Cloud tenant. These clients require no user interaction and have a Tenant admin role, which gives administrators complete control over their tenants.
Advanced encryption with Customer Managed Keys
Customer Managed Keys allows you to bring your own encryption keys to Qlik Cloud. This ensures that your organisation retains full control over the encryption keys that encrypt at-rest data in the tenant.
Reflection of Qlik Cloud November + December 2022
What a year we had. It’s hard to summarise the November and December releases in one blog, let alone trying to summarise the year of 2022. This blog has listed all the updates from November and December in bullet points, grouped into different areas of the platform, due to the high number of updates. These last months define the year of 2022, seeing not only a great number of improvements released in a high pace, but also the introduction of new features in the cloud, including AutoML, Data Gateway and the new Qlik Data Integration capabilities.
To pick out a few highlights from the past two months, I’ll have to start with the expansion of the reporting services to now include the possibility to generate reports in PowerPoint. Previously, only PDF report generation was possible. Reporting services in Application Automation are catching up with the current client-managed reporting distribution service NPrinting. For more basic reporting distribution needs, there is also the complementary Subscription feature within apps that can be utilised. Nonetheless, the PowerPoint generation means that there is additional room for customising and adapting the reports after exporting them from Qlik.
Related to the reporting distribution, other important updates are the styling options now available across multiple visualisations as well as the custom grid size of the sheet. This gives app developers more control over object placement and styling of those objects to support advanced formatting for presentations.
Last but not least is the load script history panel which allows you to save and view the last 50 versions of script changes. Perhaps a small step towards version control in Qlik Cloud, but more importantly it will be helpful when developing complex load scripts that can easily be reverted when multiple changes and scenarios have been tested.


Comments