

New connectors and templates in App Automations
With the release of Qlik Application Automation last year, users can easily build automated analytics and data-driven workflows. The automation capabilities keeps expanding and now includes the following new connectors and templates.
New Connectors:
- ai is an artificial intelligence platform.
- GitLab is a DevOps platform for development, operations, and security teams.
- Microsoft Power BI is an interactive data visualisation software.
- Tableau is an interactive data visualisation software.
- OAuth2 is a protocol for authorisation. It provides authorisation flows for web applications, desktop applications, and mobile phones.
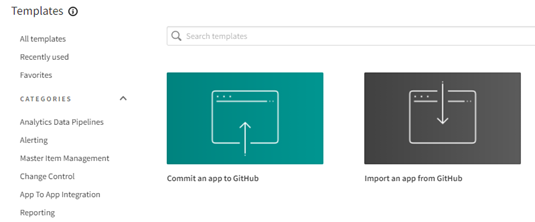
New Templates:
- Commit an app to GitHub: Saves an app and its load script to GitHub whenever the app is published.
- Import an app from GitHub: Retrieves a specified QVF file from GitHub and imports it as an app.
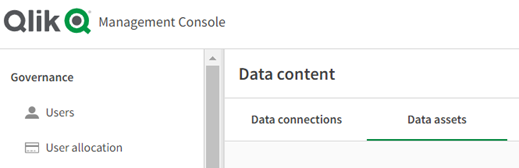
Managing data connections and data assets in the Management Console
Administrators can now view and manage data connections as well as data assets in the Management Console for the spaces to which they have access. The new improvement provides greater visibility and control over resources in the tenant and eliminates the need to go to individual spaces for managing data content.
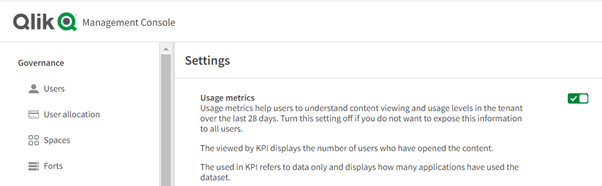
Managing usage metrics
The new usage metric setting allows tenant administrators to control whether catalog items in the tenant show KPI metrics, such as views, viewing trends, and usage. The KPIs allow you to easily understand the popularity and usage of content. The usage metric setting is turned on by default and can be turned off in the Management Console.
OData connector can access JSON data
The built-in OData connector can now load data tables stored in JSON format. All data types in a JSON response are identified, including hierarchies and collections. You can retrieve data structures in normalised data tables. Previously, only data stored in XML format was supported by the connector. The XML format was commonly used in the earlier versions of OData. The latest OData version uses primarily JSON, which makes the Qlik connector more compatible regardless of version. A big win for all the OData users out there.
New Databricks MLflow Connector
The new advanced analytics integration connector for Databricks MLflow allows you to interact with and explore live calculations made on the Databricks platform directly within Qlik Sense dashboards.
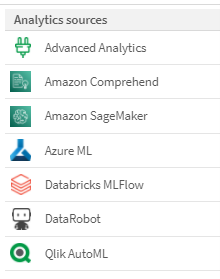
Updated support for Azure ML
The Azure Machine Learning Connector now supports the following services:
• Automated ML
• Designer
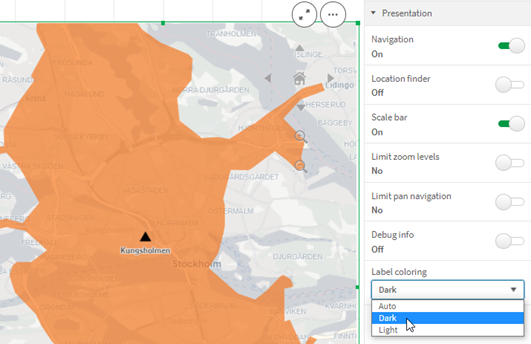
Label colouring with map chart
A new map setting with options for label colouring is now available in the map chart. The new options allows you to customise how labels contrast with the base map or coloured areas. Select Dark or Light to set a specific label colouring to use independent of the base map colour. If set to Auto, the label colouring will automatically adjust to provide the best contrast with the colour of the base map.
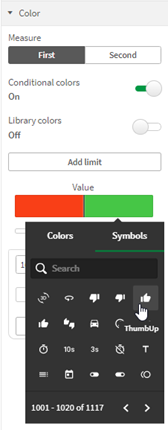
KPI background colour and new icons
Users can now add background colours to KPI charts, providing more flexibility when customising the visualisations. An extensive collection of new icons (1000+) has also been added to the existing icon set when setting conditional colours to the measures.

Hybrid Data Delivery: Scheduling reloads of a Full load only landing data asset
This feature lets you control the frequency of a full load by defining a schedule that determines when the full load will run. You can schedule a full load refresh to execute hourly, daily, weekly, or monthly.
Hybrid Data Delivery: Support for Azure Synapse Analytics
This feature adds support for Azure Synapse Analytics as a target for the Hybrid Data Delivery service. You can now continually load on-premises data into Azure Synapse Analytics for downstream analytics initiatives.
New Qlik Download Site
The Qlik download site has a new location and an improved user experience. Tools that still needs installing on your local systems can also be downloaded from the Tools page in Qlik Cloud. The Tools page can be found at the bottom of your Profile Settings view.
Reflection of Qlik Sense SaaS February 2022
Plenty of new functionality has been released in the short month of February. This month the focus has mainly been on expanding the data connectivity and improving the tenant administration.
Qlik Application Automation now includes five new connectors and two new templates to help you get started building automated workflows. The GitLab connector and the GitHub templates will help app developers to access external tools for collaboration and version control of apps and code scripts. This takes Qlik Cloud one step closer to automate version control of the applications. The Microsoft Power BI and Tableau connectors is another interesting addition to Automations which means that you can get or post data from the other leading BI tools. This integration can be useful for companies that use more than one BI tool across their organisation and emphasizes that Qlik is not mutually exclusive with other BI software.
Other data connectivity enhancements include the new advanced analytics Databricks connector and updates to Azure ML and the OData connector. The OData connector update means that users no longer need to manually configure the generic REST connector to retrieve data in a JSON format from an OData source.
Improvements for tenant administrators include managing data content and content usage metrics from the Management Console. Getting an overview of the tenant’s data connections gives the administrators better control over the resources when the number of connections increases and are scattered across multiple spaces.
Last but not least we have seen a few improvements in the user experience. The map chart colour labelling options and the KPI background colouring are minor styling options that makes a great impact when using the visualisations. The more styling enhancements included in the native visualisations, the less the need for the creation of custom themes.


Comments