

As the UK’s leading Qlik experts, we know how useful Qlik‘s Insights Advisor can be but after speaking at a Qlik Meetup, Chris Lofthouse realised not everyone was unlocking the tool’s power. Here he looks at two use-cases for Insight Advisor.
Recently I had the pleasure of presenting at the Qlik Meetup in Birmingham, where I spoke about a number of things, one being the Insights Advisor.
Interestingly, I found out that relatively few people in the room were getting the most from it, which was great for my presentation but made me aware Insight Advisor’s full potential was not being realised. The general consensus was it was “a bit gimmicky” or “rarely useful”. Therefore, I thought I’d provide an alternative use-case which hopefully gets more people using it, even if it’s not in the manner it was originally created for because I think it’s great and not just for suggesting new visuals.
Insights Advisor Use-Cases
The Primary Use-Case – Visualisation Suggestions
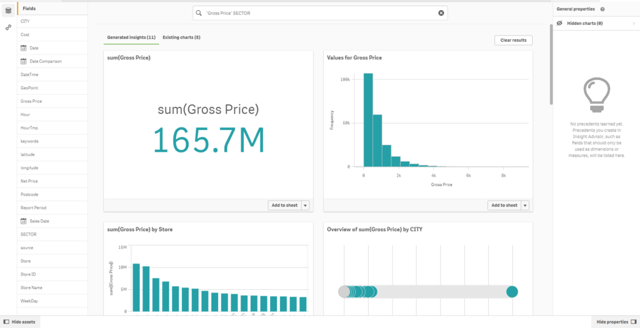
If you haven’t guessed by now, the primary use-case of the Insight Advisor is for suggesting visualisations. This maybe the least useful for visualisation developers because they typically know how they want to visualise data by the time it’s loaded into their application, but it would be premature to overlook the Qlik Insights Advisor for this reason. This is because at the very least it helps quickly create the obvious visualisations such as KPIs but also aids the creative juices by showing visuals you may use less frequently or ones you’d never use at all. Therefore, this speeds-up the fail-fast philosophy further and eliminates the monotonous creation of simple visuals such as KPIs.
While the target audience of the Insight Advisor is not advanced Qlik Sense users, it is typically those individuals whom are relied upon within a business to inform other users of functionality such as this. Hence, it shouldn’t be overlooked by them. Interestingly, even analyzer users can use the Insights advisor to self-serve and create new dynamic views – although they won’t be able to save/create new sheets with the results – which is why it’s so great that it requires minimal time and effort.
To generate insights, users simply need to click the generate insights button upon opening the Insights advisor. To hone Qlik’s results into something more relevant, users can use natural language to type what they want to see or click on the relevant fields/master items on the left of the screen. In the SaaS offerings of Qlik, this now supports deeper natural language processing capabilities that enables users to filter the data set at the same time as generating the visuals (incorporating SET expressions), we should hopefully see the trickle down to the QSoW (Qlik Sense on Windows) version in 2020. My advice would be to incorporate this into your application build process now, as it should speed up development in the future, even if it’s just to look at what you wouldn’t do!
An Alternative Use-Case – Navigation & Familiarisation
A common issue I come across when on-boarding new users is that they aren’t familiar with the applications developers have spent time creating, so they don’t use them as often as we’d like at first! This is a great alternative use-case of Qlik’s Insights advisor, familiarisation. With a quick 5-10 minute demonstration, highlighting that any user can go to any application and open the Insights advisor, type the question or data fields they are interested in, select the ‘Existing charts’ tab where they have the ability to click on the hyperlink, located in the bottom-right corner of any visualisation, and be taken to the corresponding sheet removes the familiarisation gap.
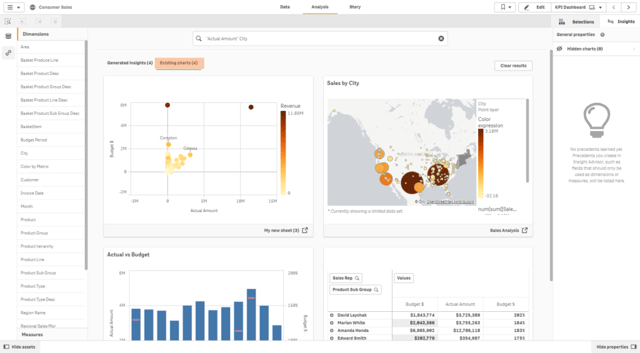
This provides all users with a simple and consistent approach to familiarise and navigate around an application that may contain few or many sheets. They don’t need to know which sheet contains which visualisations, the Insights advisor brings together a collection of all existing charts into a single view, related to the dimensions and measures the user is interested in analysing. And, with a link to the sheet, which may add further context to the individual visualisation presented, what more can a user want?
I’d love to hear other users thoughts on the Insights advisor, do you use it and if so, how?
As always, feel free to drop a comment below or on our social media channels, Twitter, LinkedIn or YouTube and remember to click the follow button if you liked this article.
By Chris Lofthouse
Follow @clofthouse89


Comments