

With everyone discussing COVID-19 and self-isolation, let’s distract ourselves for a few moments and take a look at the exciting new Qlik Sense April 2020 release. Coronavirus hasn’t impacted Qlik’s ability to deliver another feature-packed release in 2020, which will definitely have you yearning to upgrade your Qlik environment immediately. My three favourite features in this release are improved Bookmarks, Sheet triggers and Relative modifier!
Qlik Sense April 2020 Release’s New Features
Share Bookmarks
This feature gets me most excited, and has long been on my wish list. In Qlik Sense April 2020, Bookmarks just got more useful with the ability to publish and collaborate with your peers… but wait, there is more. Now, when creating a bookmark you will have more granular control. For example, you can determine whether the bookmark should navigate to the sheet it was created on and if it should save the layout (sorting and presentation of a pivot table).
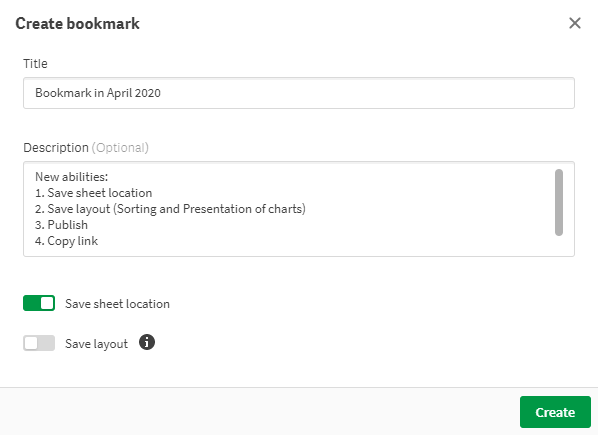
I know the save sheet location feature is a welcomed feature as I find myself wanting to apply bookmarks without navigating away from my active sheet. This was previously possible via a right-click and ‘apply selections only’. However, for newer Qlik users this will help improve the UX (user experience) where bookmarks have been set up on their behalf. The save layout option has a lot of potential – currently limited to the pivot table, it stores the layout state (sorting and expanded/collapsed rows). I would like to see this impact the entire dashboard, though. For example, where I can define a custom view, controlling layers in a map and sorting on all objects. What I would also like to see, which has just popped into my head but not entirely, is the ability to set references between selection states, as you could with QlikView.
Back to bookmarks though – once created, you can now right click and Publish, providing you’re in a published app of course.
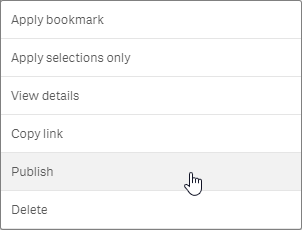
Publishing a bookmark results in it moving into community bookmarks, or ‘published by me’, and becoming accessible to all that have permission to view the app. You can also see from the image above that a ‘Copy link’ option has also appeared. This gives you the ability to share bookmarks via e-mail, Slack, Microsoft Teams, etc. A really neat feature. I for one will be using this a lot to collaborate internally and I’ll be highlighting it to all our customers too. This couldn’t have come at a better time, as it’ll help Qlik users stay connected and collaborate more easily while they are in self-isolation.
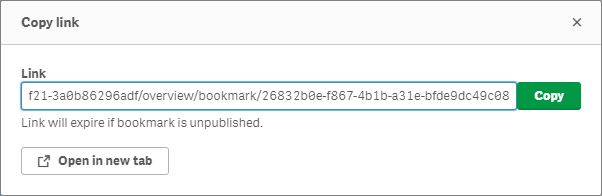
It’s worth noting you can ‘Copy link’ of unpublished bookmarks but Qlik will prompt you to publish them. Equally, if you unpublished a bookmark the link provided will expire.
Sheet Triggers
More functionality moving over from QlikView. This time in the form of Sheet triggers. In the sheet properties menu you’ll now see an Actions tab:
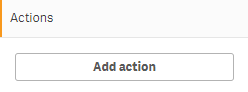
You are able to add multiple actions to a single sheet, actions vary from changing the selection state, field state, applying Bookmark and setting variables.
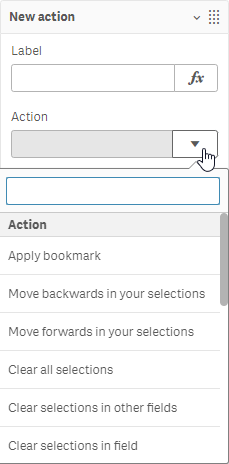
The full list of actions are as follows:
- Apply bookmark
- Move backwards in your selections history
- Move forwards in your selections history
- Clear all selections
- Clear selections in other fields
- Clear selections in field
- Select all value in field
- Select alternatives
- Select excluded
- Select possible values in a field
- Toggle field selection
- Lock all selections
- Lock a specific field
- Unlock all selections
- Unlock a specific field
- Set variable value
Sheet triggers are fantastic for improving the user experience and guiding users through the analysis. However, it must be noted that, in the same vein as QlikVIew, they are not supported with Qlik NPrinting.
Relative modifier
A new modifier has been added to Bar, Combo, Line and Table charts which allows Qlik users to quickly and efficiently create a share and percentage of total value from a measure. Previously, this required some advanced expression knowledge, using things like the Total qualifier and even Set Expressions. In Qlik Sense April 2020 though, we have a expressionless means to achieve some extremely insightful visualisations.
By changing the modifier to Relative numbers, located under the expression input within the measure. You will be provided with a couple of new options:
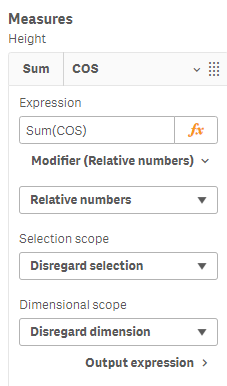
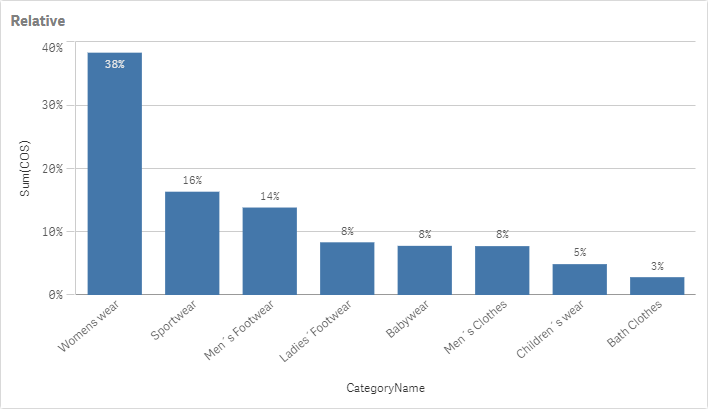
The first sets the Selection scope. In this option you control whether the expression should consider the current selection state, define your own selection state with ‘Select a field value’ or ‘Disregard selection’. This provides a lot of control over what data should be included in the measure without having to be technical at all. You can also control the dimensional scope in the same manner, the options for this are ‘Repect dimension’ or ‘Disregard dimension’. By disregarding the dimension scope, it will provide the share of the measure value across all dimensional values like so:
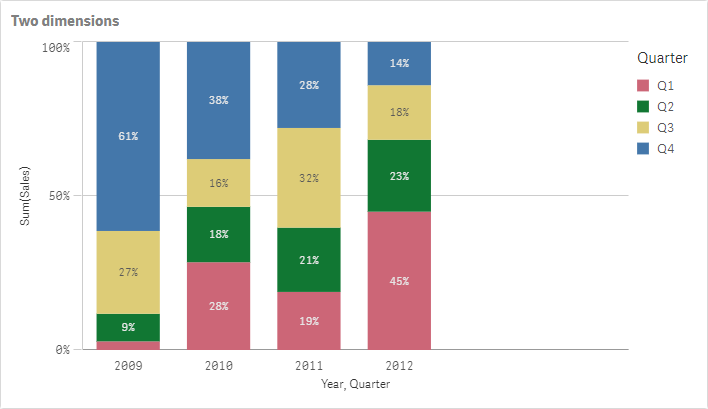
Whereas, if you have two dimensions in a single chart and you chose to respect on of those dimensions it will produce full height bars:
This can really make for some interesting visualisations – take this example using relative modifier and respecting one dimension in a line chart:
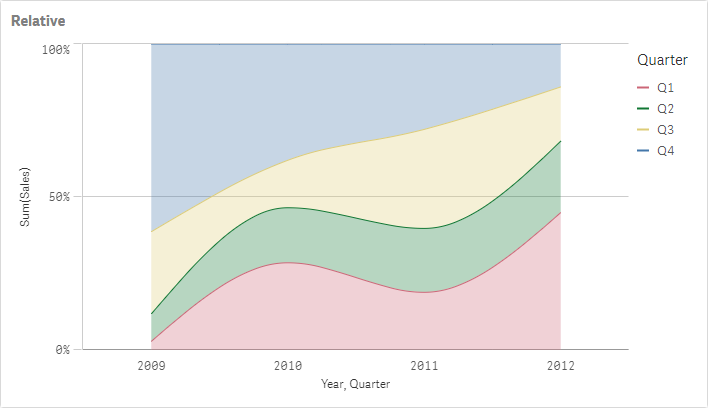
It’s features like this relative modifier that make working with data platforms, like Qlik Sense, enjoyable and lightening fast at discovering those previously unseen insights into your data.
Global navigation improvements
Qlik have made some subtle improvements to the navigation of a Qlik Sense app in April 2020. The most notable difference is the center buttons have been enhanced to drop-down options:
Qlik Sense February 2020 (Before):

Qlik Sense April 2020 (Now):

My initial thoughts are positive. In particular it clarifies where it will navigate you when clicking the formally-Data button, now-Prepare button, with the option to quickly override this too. In the Analyze drop-down you have the Sheet view and Insights (Insights Advisor). Narrate (storytelling) remains without a drop-down.
Org Chart
Qlik have expanded their visualisation bundle once more, this time with the org chart. This particular chart is designed to show cards in a hierarchy like, you may have guessed it already, a organisational hierarchy. Each card in the org chart presents a dimensional value, in this example managers/employees. The number beneath each card in this example represents the number of employees that reports to that person. Clicking on these numbers will expand/collapse the tree-hierarchy.
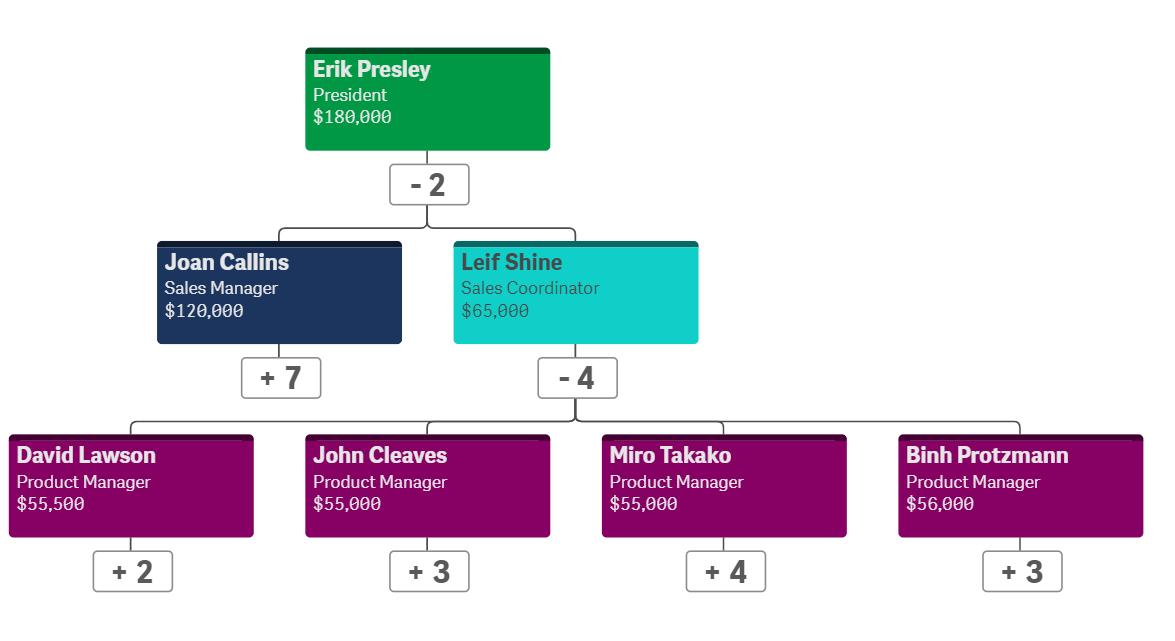
In the properties, you can set background colour, descriptions, labels, etc. It’s possible to zoom and pinch and pan. This visual has a very limited use-case but it’s still nice to see Qlik’s commitment to offer a wider variety of chart types.
Pivot table improvements
In addition to the ability to save pivot table layouts with a bookmark, Qlik have also added the much requested feature of Sorting by the first measure. Thank you Qlik, it’s about time!
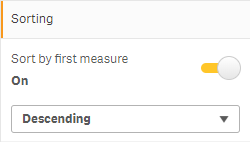
One thing to point out is that the Row dimensions must have subtotals enabled. Something else I’ll point out is the ability to sort in search!
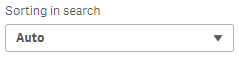
Here, you can control the sort order of the values in the filter panes that appear when you click one of the dimensions in the pivot table. It is possible to set it to ‘Auto’ which appears to sort it by the top priority sort condition – that being the order of the fields or first measure, if enabled, or ‘inherit from dimension’ which sorts based on the respective dimensions settings – very nice!
KPI chart improvements
The main improvement for the KPI this month is probably the biggest headache I have with it, being a perfectionist, and that’s having more control over the behaviour of the font size. Previously, the font size was responsive, now we can choose from two other modes – Fluid and Fixed:
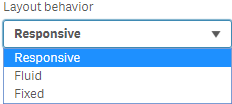
Here is a brief description for each:
- Responsive: Resize font to always fit the text (as it does in <=Feb 2020).
- Fluid: Resize font to box. Keep the size of the objects consistent to ensure the same font size.
- Fixed: Always the same size font.
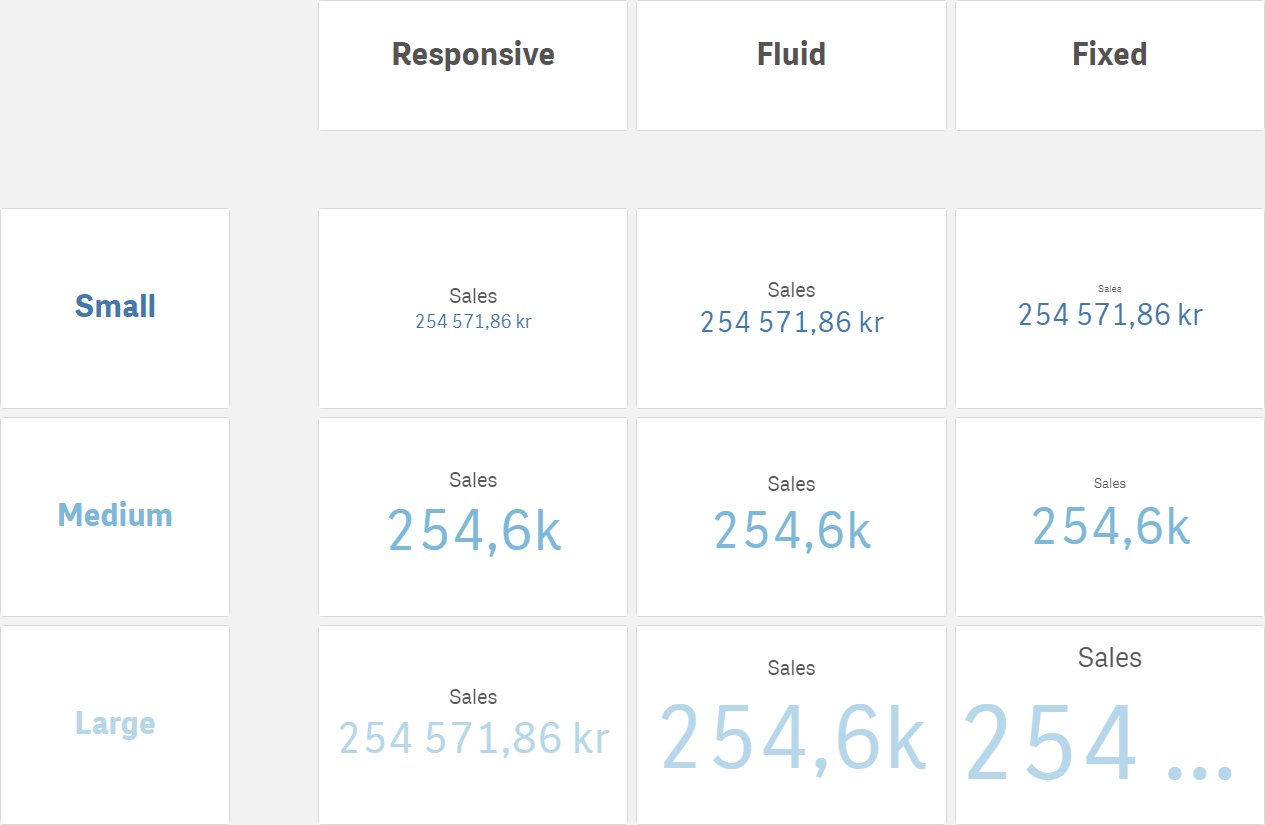
Consistency always completes the look of a dashboard and just make it look that bit more appealing. This is a nice win for Qlikkies and perfectionists.
Other chart improvements
Qlik have also rattled off some more improvements:
• Number formatting of colour and size by measures in the map chart.
• Higher limit of items on point and area map layers: 50 000.
• Exclude Qlik logo on map chart.
• Hide default measures in custom tooltip (Combo, Treemap, Bar, Scatter, Map chart).
Dynamic Views
Qlik have brought Dynamic views to Qlik Sense on Windows. This provides Qlik Sense users the ability to refresh the data across multiple charts on-demand, to maximise system performance. Dynamic views are particularly well suited for cloud-based data warehouses, such as Snowflake.
‘Dynamic Views allows users to utilise the in-memory capabilities of the Associative Engine as well as deliver near-real-time data directly from the source. This allows greater control over what and when data within a chart can be updated. If there are multiple users of the same app, each user individually controls when the chart they see is updated. Dynamic Views will work with any kind of chart, including extensions, as well as with any data source that’s connected to the app. And an app can contain both Dynamic Views and regular charts.’
I’ll certainly be looking to get hands-on with dynamic views in a future blog post. Until then, here are some resources that might be of interest:
Conclusion
I think 2020 has been Qlik’s best year so far in getting new features and visualisations that have had significant impact on improving user experience and development efficiencies. Those first three features in particular are my favourite – Sharing bookmarks will make collaboration that bit easier, sheet triggers will improve user experience and relative modifiers will provide richer analysis with less effort. This makes it that much more important for those that haven’t upgraded so far this year to do so.
Should you need any assistance in upgrading your environment(s), please get in touch with me and my team and we’d be happy to help. Any Ometis customers on our Proactive support offering can use one of their free upgrades, I can see a lot of users benefiting from this release.
By Chris Lofthouse #QlikLuminary
Follow @clofthouse89


Comments