

We’re already midway through the year, which means it’s time for the Qlik Sense June 2019 release and as the first release to follow Qonnections, it doesn’t disappoint.
The Qlik Sense June release often showcases the bulk of Qlik’s innovation for the year and, although there’s not as much new functionality as previous years, there’s plenty to get our teeth stuck into as well as numerous improvements. So, let’s take a look.
We’ll start with a short video I’ve created to walk-through some of the new features and functionality:
User-Interface Updates
First things first, I want to cover some subtle tweaks to the UI in Qlik Sense June 2019 which often go awry between releases.
- The loading rings/bubbles are no more, a new loading screen has superseded the pulsating rings. It certainly looks slicker in my opinion.

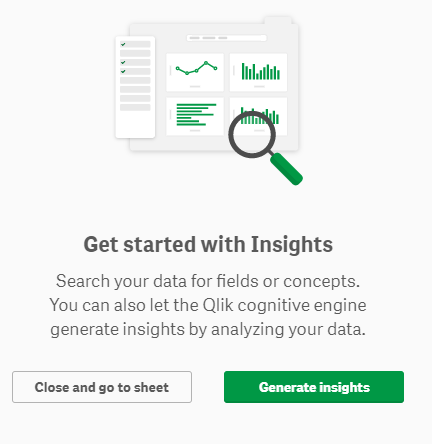
- When initially loading data via the Data Manager, Qlik would navigate the user to the Insights Advisor after the reload had finished. I found this often confused users who didn’t immediately know how to close the Insights Advisor. It’s therefore nice to see they’ve added a ‘Close and go to sheet’ button now.
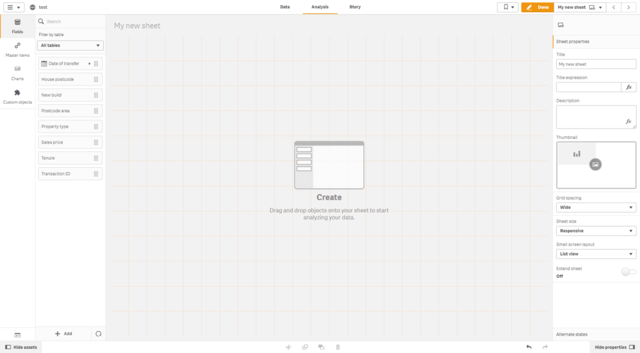
- Qlik have once more changed the styling around the Sheet View. This time opting for a lighter, brighter user-interface. While this makes the Asset and Property panel feel more passive, focusing users on the sheet itself, it is more difficult to identify the active tab.
New Default Theme
As well as changes to the UI, Qlik have opted to change the default theme from Sense Classic to Sense Focus. This fits consistently with their overall UI – notice the background is now light grey, so the objects pop out?
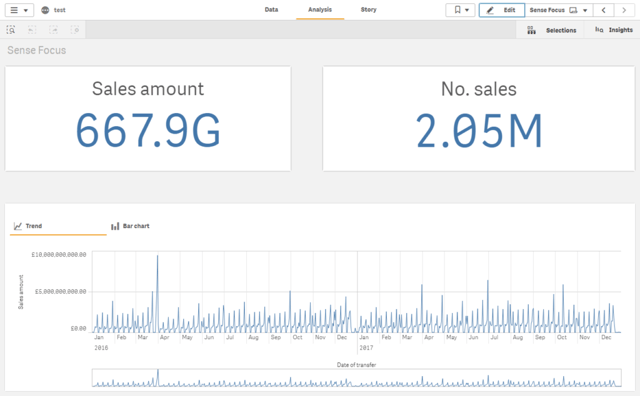
Personally, I preferred Sense Classic because Sense Focus makes each visual appear isolated and disconnected from each other, which isn’t very associative – but that’s just me!
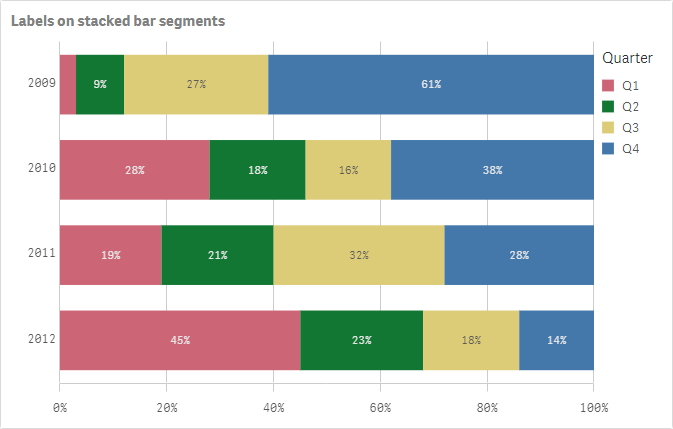
Improved Bar Chart
Qlik have reengineered the bar chart, which is now based on Picasso.js. Features include:
– Labels on stacked bars
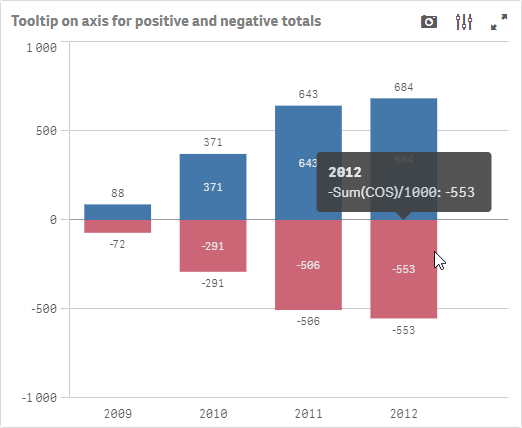
– Improved tooltip for stacked bars which displays positive and negative totals.
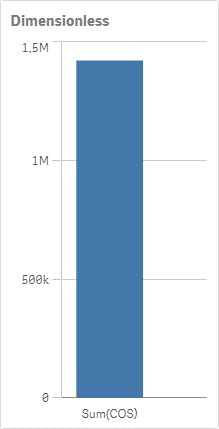
– Can show measures without dimensions (dimensionless).
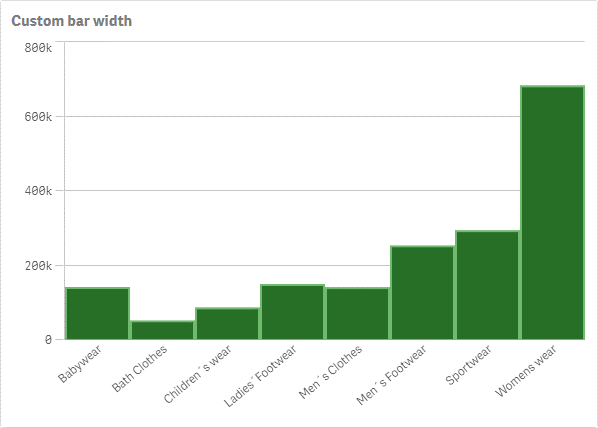
– Styling options for the number of bars: auto, all or a fixed number.
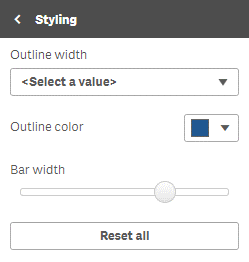
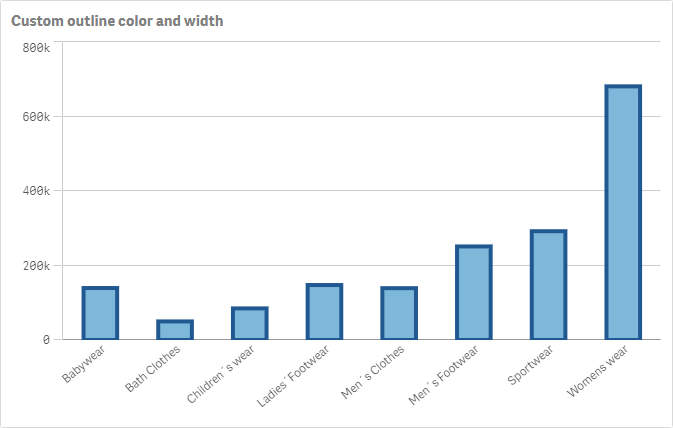
To modify these properties you must navigate to the Advanced styling properties menu via Appearance > Presentation > Styling: ![]()
This will take you to the advanced styling properties panel. Here you have the option to change the outline width, outline colour and bar width.
– Styling options for stroke colour and width and bar width.
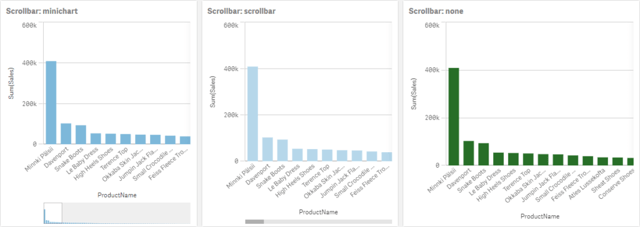
– Toggle mini-chart for all, not just for continuous axis. Controlled via Appearance > Presentation > Scrollbar.
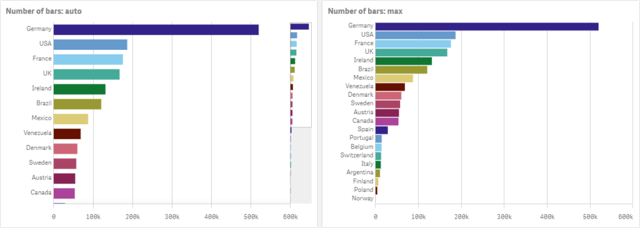
– Styling options for the number of bars. This is controlled via Appearance > Y-axis > Number of bars option. You are provided with the ability to set this option to auto, max or custom.
– The added improvements to the bar chart is very much welcomed. However, I do recommend not abusing these advanced styling features, or risk making ugly visuals for your end-users. In the future, I hope we see some of these options available for some of the other objects too. Based on what I learned at Qonnections, I believe we can expect to see some of these options added to the pie chart in the near future.
Copy Cell Value To Clipboard
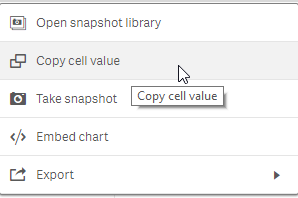
Continuing with chart improvements, the table and pivot table objects have finally had the ability to copy cell values to clipboard added to their resume. A piece of gap functionality to QlikView closed off. Simply right-click on the cell value you wish to copy and click the option.
Map Exploration Menu For Map Object
The map object now enables users with the ability to control some of the cosmetics of a map object using the exploration menu: ![]()
In Qlik Sense June 2019, users can toggle show layer and labels and customise object size, base map, map language, legends and zoom mode.
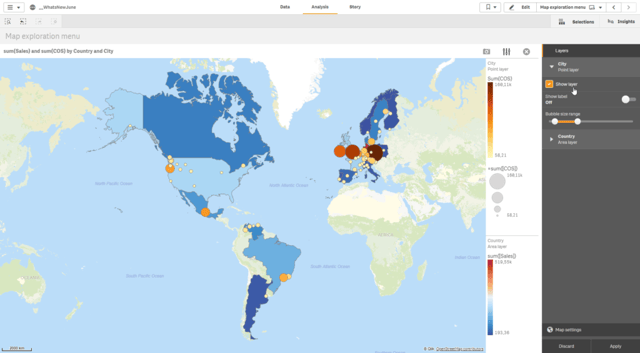
It’s great to see these much-required improvements come to the map object, providing more granular control over when a layer is shown.
Trellis Container
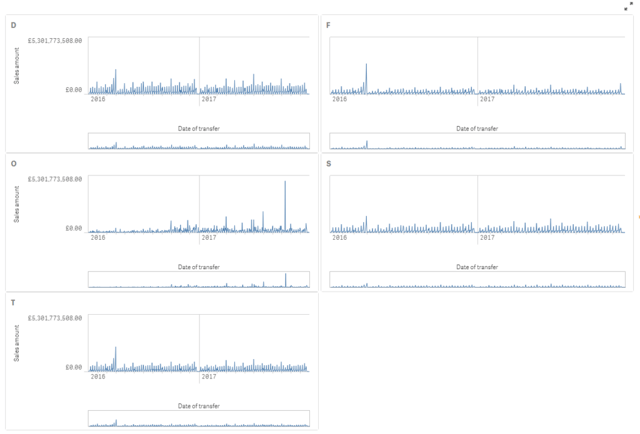
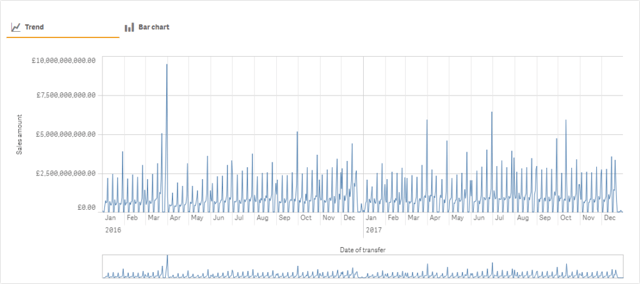
Kicking off the new features is the Trellis Container, which has been added to the visualisation bundle. This is another piece of gap functionality between QlikView that is now in Qlik Sense. For those who are new to Qlik, the Trellis Container enables users to create multiple visualisations from a single master visualisation that is split across the values of a specific dimension. For example, below demonstrates a master visualisation showing sales by date for each property type:
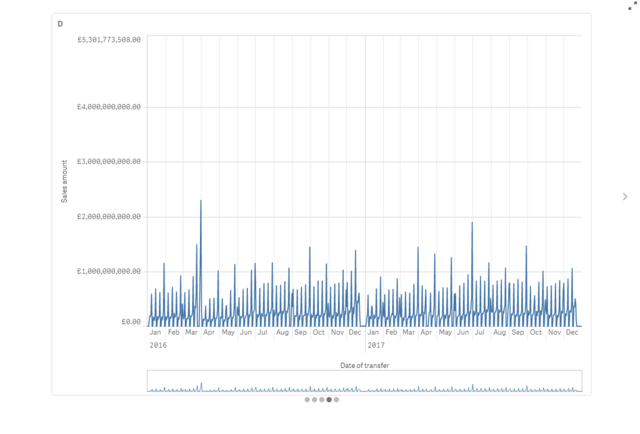
There are several options you can choose from – for example, instead of grid view, like above, you can toggle slide mode which switches to a modern website carousel (notice the dots at the bottom):
 P&L Pivot Table
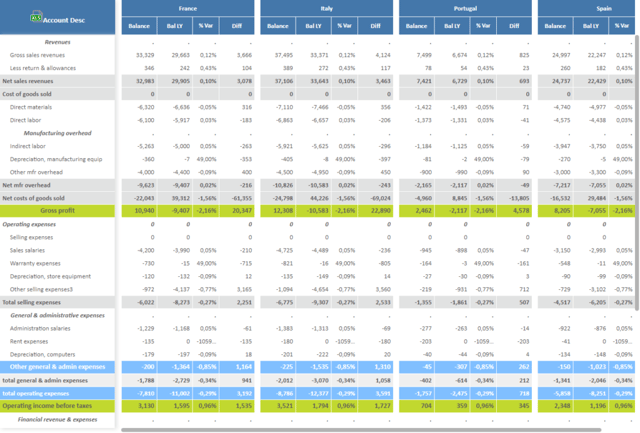
The other object added to the visualisation bundle in Qlik Sense June 2019 is the P&L pivot table. This extension provides customisable options for easier creation of financial reports such profit-and-loss statement. While this is still a clunky solution to achieve advanced styling for financial reporting, it works a treat. Based on the dimension row value you can specify tags to bold, italic, change background colour, font colour, align, indent and comment. Here’s an example:
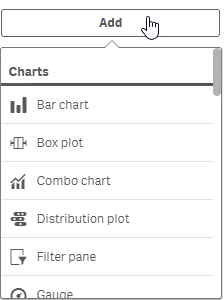
New Native Visualisation – Container
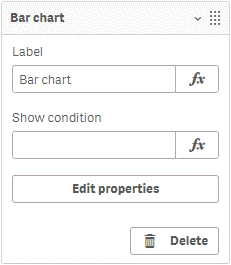
Something I personally started to use frequently was the Tabbed Container in the dashboard bundle. Now, Qlik has added a new container object to the native charts library. It’s the Tabbed Container object on steroids! Seriously, it’s a big improvement over the Tabbed Container from the dashboard bundle. The first big improvement is that it has a true Qlik Sense object user experience. It has a similar menu to the native map object, when navigating between layers. However, instead of Layer Properties, you navigate between Object Properties of the housed visualisations. To do this, navigate to the object and click on ‘Edit Properties’.
There are two downsides of this object I noticed, the first is you can’t seem to justify the tabs across the entire object, like you could with the Tabbed Container. Secondly, the container object has no support for NPrinting but this is supposedly planned on the roadmap for future releases.
Last but no means least, you can actually add visualisations directly to the container, it does not solely rely on master visualisations – so much better!
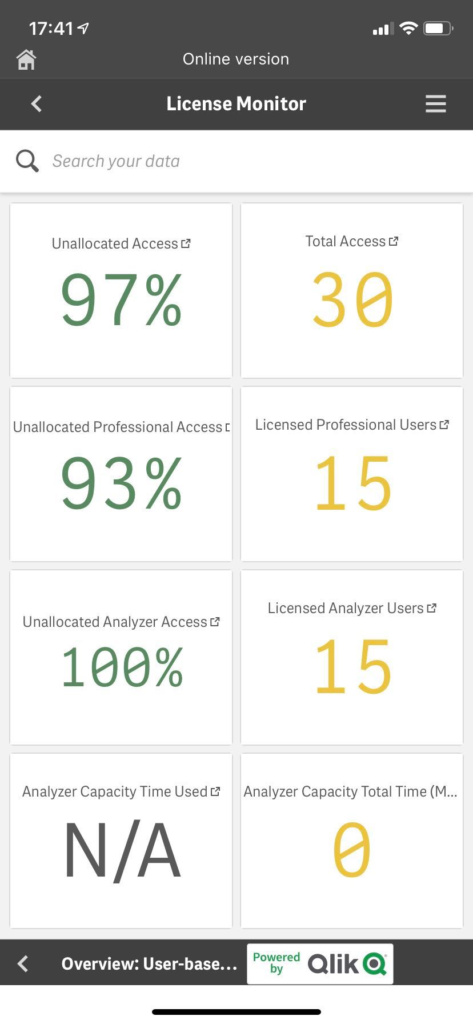
New Grid Layout For Mobile Devices
In the sheet properties you now have the option to change the layout option for small screen layouts. The default option is List View, as it has been pre-Qlik Sense June 2019.
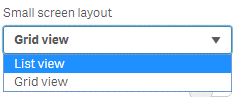
However, you can now switch this to Grid View which allows objects to be displayed alongside each other on mobile devices (must have Qlik Sense mobile June 2019 installed)– pretty neat.
Mobile Push Notifications For The Android And iOS App
The last added feature is system push notifications to the Qlik Sense mobile app, currently compatible with the Android and IOS versions. This enables administrators to push notifications to their Qlik users. It’s important to highlight the key word ‘push’. In its current form this is a manually triggered notification distributed via the Qlik Sense mobile app. As far as I can tell, this only works with Qlik Sense mobile June 2019 and you must also have a signed licensed applied to the server, and not the older license key and control number – something I found out the hard way!
Whilst limited to manual triggers currently, this does lead itself nicely towards updating users on maintenance windows/planned outages. It can also be useful for informing users when data has been refreshed or issues/bugs have been reported. For each system notification, you can create a message with a link to a specific Qlik Sense app. The link is formed of the following:
qliksenselink://{full URL of Qlik Sense app}
To reduce notifying all users about everything, it is possible to select individual users or a group to receive each system notification.Alternatively, you can create a system notification policy to determine to which recipients a notification is distributed to. Policies can be reused for multiple notifications.
In the future I’d like to see this evolve further, allowing for notification riggers to be based on the status of application reloads i.e. notifying administrators of failed reloads, or notifying users of successful reloads. Interestingly, at Qonnections this functionality was mentioned alongside data-driven notifications, so hopefully that means it’s not far from becoming a reality. This has been reconfirmed by Vinay Kapoor, director of product management at Qlik, in the technical preview forum:
“System notifications on the mobile app is the first step in our journey to deliver notifications (system AND data driven) across all our platforms. Definitely plan to bring it to the hub and web UI, stay tuned!”.
Qlik Sense June 2019 Release Summary
Despite not having any real meaty innovation in this release, possibly due to it coming earlier this year in the form of Associative Insights, it is clear Qlik are still committed to continually improving the user experience of Qlik Sense with the improvements to the user interface and addition of system notifications.
Qlik Sense June 2019 also demonstrates the evolution of the chart library, with many improvements to the bar chart and map object, and further additions of the Trellis Container and P&L Pivot Table. Lastly, with the new ability to change to Grid View for mobile devices, it’s clear Qlik are taking mobile access seriously and I know a few customers who’ll love this particular feature. Therefore, the total package results in a serious upgrade for all Qlikies.
For more information of all things Qlik, remember to follow us on LinkedIn, YouTube and Twitter, or feel free to contact us directly.
By Chris Lofthouse
Follow @clofthouse89


Comments