

The latest release of Qlik Sense on Windows provides a number of enhancements, mainly in customising the Insight Advisor but also in configuring visualisations. These enhancements will assist app developers in fine-tuning the analytics experience for the users. Let’s start with the news in Insight Advisor.
Augmented analytics
Custom chart periods
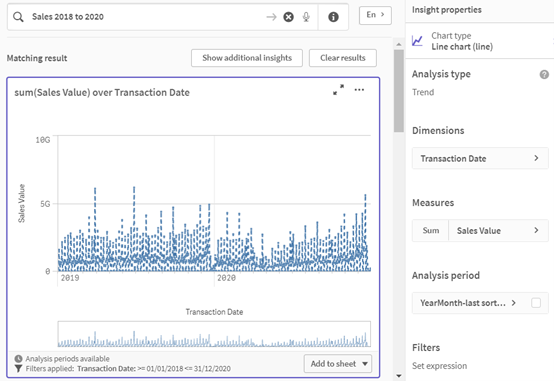
Users can now customise the analysis periods used by Insight Advisor. Previously, users would need permissions to change the business logic. Going forwards, users can make these changes on demand, getting the insights they need quickly. Simply select the desired time period dimension in the Insight properties of a chart.
Period over period analysis in Insight Advisor
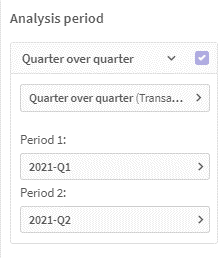
Users can now compare a change in a measure of one period versus another by using the Period over period analysis in Insight Advisor. The analysis lets users visualise how a measure differs between two periods of analysis.
The analysis periods can be configured in the app’s Logical Model (figure 1) where you can create and define Calendar Periods and then apply it to a field or a group of fields using Behaviours. Once you have defined a calendar period, go to the Insight Advisor and generate charts. When you click on a generated chart where analysis periods are available, you can apply the calendar period using the Analysis Period section (figure 2) in the Insight Properties panel.
Figure 1
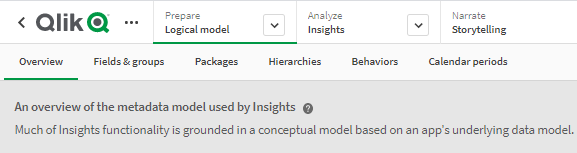
Figure 2
Consistency in accessing fields and master items across Insight Advisor
When you have business logic applied to a published app, users can search for available fields and master items based on the logical model regardless of their permissions in the space. The access to fields and master items can now be summarised as follows:
- When an app has business logic turned on, users can query all fields set to visible in the app.
- When an app has business logic turned off:
- Users with edit permission on the app can query both fields and master items.
- Users with view-only permissions on the app can only query master items.
Creating custom responses to questions in Insight Advisor
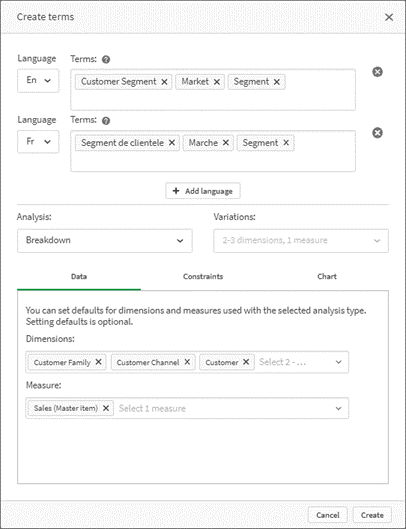
Custom analyses allow you to create custom responses for specific phrases in Insight Advisor. You can define the analysis that will be returned, using specified input fields. This helps you control the auto-generated analytics the users receive, and enables the creation of preferred analyses. You can define the terms in different languages for a custom analysis. As of this writing, supported languages include English, French, Russian, and Spanish. The custom terms can be defined in the Business Logic Vocabulary, located in the Prepare tab in the Sheet view.
Visualisations
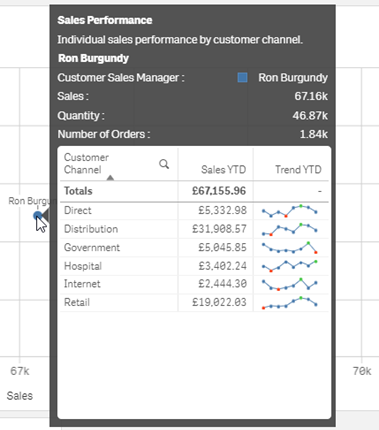
Add charts in tooltips
Further customisation of tooltips is now available in the properties panel with the ability to embed a master visualisation inside the tooltip. This allows users to visualise a chart overview in the tooltip which inherits the selected dimension value. Tooltips display when you hover over a visualisation.
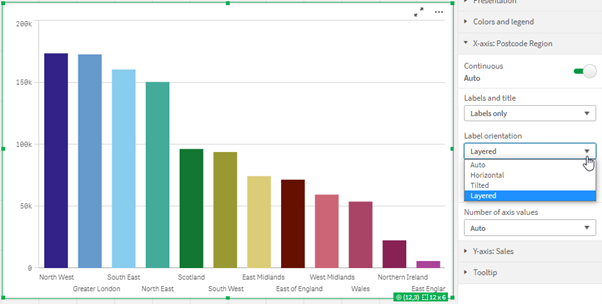
Layered labels
The new layered label orientation for chart labels helps users to utilise space better and allows more room for the graph. In addition to label options like auto, horizontal, and tilted, you can now layer your labels on the X-axis.
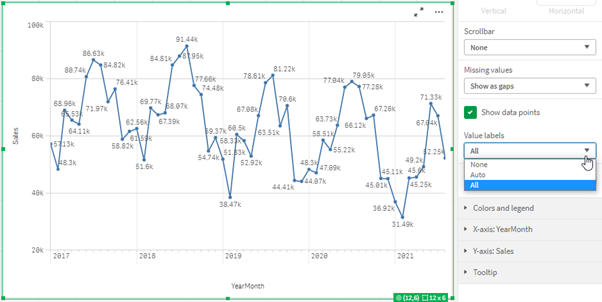
All value labels visible in line chart
The line graph data value labels have been enhanced with a new ‘All’ option, which forces the value labels to always remain visible. Additionally, the ‘Auto’ option, which automatically shows value labels based on the space available, has been improved to display more labels.
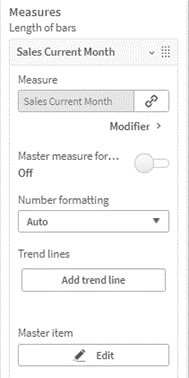
Editing master items from the property panel
Users can now directly edit master items from the properties panel in a visualisation. This eliminates the prior need to navigate to the master items library in the assets panel to make changes.
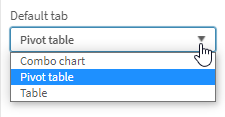
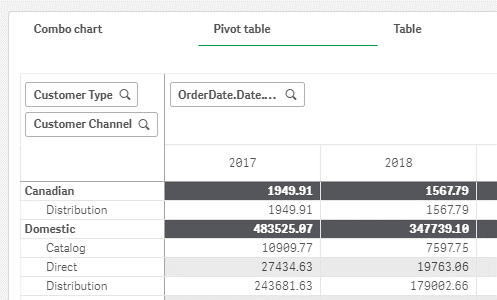
Define default tab in container object
By default, the first tab is displayed when you open an app and view a container object. Previously, this setting was not editable. Now, users can set any tab to be displayed as the default tab when opening an app and viewing a container. In the edit sheet mode, simply go to the container’s Properties > Appearance > Container and set the Default tab.
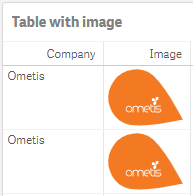
Images in straight tables
You can now add images by URL to rows in straight tables. In the column Representation section, select ‘Image’ as representation and ‘Add URL’ as Image setting. Paste the URL address as a text string in the Image URL expression editor.
Platform
NVDA and Chrome screen reader support
Qlik Sense now supports the NVDA screen reader for Microsoft Windows and Google Chrome. The NVDA screen reader is a third-party product and users need to obtain their own license for the screen reader.
Adding support for SCRAM password encryption
The default password encryption for the PostgreSQL database is MD5. You can now change this to SCRAM after installation from the pgAdmin desktop app.


Comments