

The Qlik Sense September 2020 release has been a big leap forward, particularly for Qlik SaaS editions. Now bundled with Qlik’s Insight Advisor Chat, at no extra cost, Qlik SaaS editions are pushing the boundaries and providing ever greater value for money. With this latest release, time to insights has dropped significantly, and coupled with the introduction of Qlik DataTransfer, Qlik has made us at Ometis SaaS advocates in a very short space of time. The question today is not “Why go SaaS?”, it’s “What’s stopping you going SaaS?”, which is a question I’ll be answering in a future blog. This post, however, is all about the new and impressive Insight Advisor Chat.
History
Let’s have a quick look back into the origins of Insight Advisor Chat. Back at Qonnections 2018, Qlik’s R&D team demoed a proof of concept chat bot which could marry your questions to measures, dimensions and visualisations from your Qlik applications. Fast-forward a little over half a year and Qlik acquires CrunchBot, which quickly becomes Qlik Insight Bot. This was a product we were partnering with just prior to the acquisition and it was really impressive to see. The demo sold itself, but the price was too high for most and the installation was quite complex and cumbersome to easily offer out proof of concepts to prospects – the install had a lot of different components trying to communicate together and at times you could compare it to watching people on reality TV having an argument – painful and going round in circles! Now, however, that’s all gone away. Qlik have bundled the newly-named Insight Advisor Chat into the SaaS editions for quick and seamless setup and I’ve heard recently that we can expect a similar plug-and-play experience in the upcoming November 2020 release for the Client-managed editions, including Windows.
What is Insight Advisor Chat?
Insight Advisor chat is a chat-based interface for querying insights from apps using natural language. Picture Google Search sitting on top of your data – that’s Insight Advisor Chat.
Conversational analytics (Insight Advisor Chat), enables all users to query data using a familiar search-based interface. Therefore, organisations can strip away the technical know-how, and move beyond dashboards to gain insight and value from data. Simply ask a question and Insight Advisor Chat will instantly generate relevant answers, visual analytics, and narrative insights that deepen understanding.
How do I set it up in my SaaS tenant?
Enabling an app to be searchable by Insight Advisor Chat is a simple click of a button. By default all apps have Insight Advisor Chat disabled. To enable an app, open it and navigate to the app options panel and toggle the Insights for chat in Hub option:
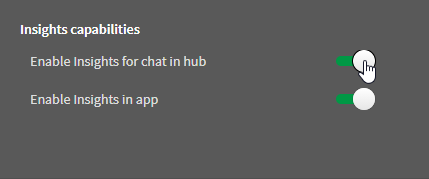
And that’s it, you can start querying your app!
Chatting with Insight Advisor Chat
With your app/s enabled you can start querying the Insight Advisor Chat. To begin, navigate to the Cloud Hub and click on the Insight Advisor Chat button in the header of the page. Let’s look at the interface:
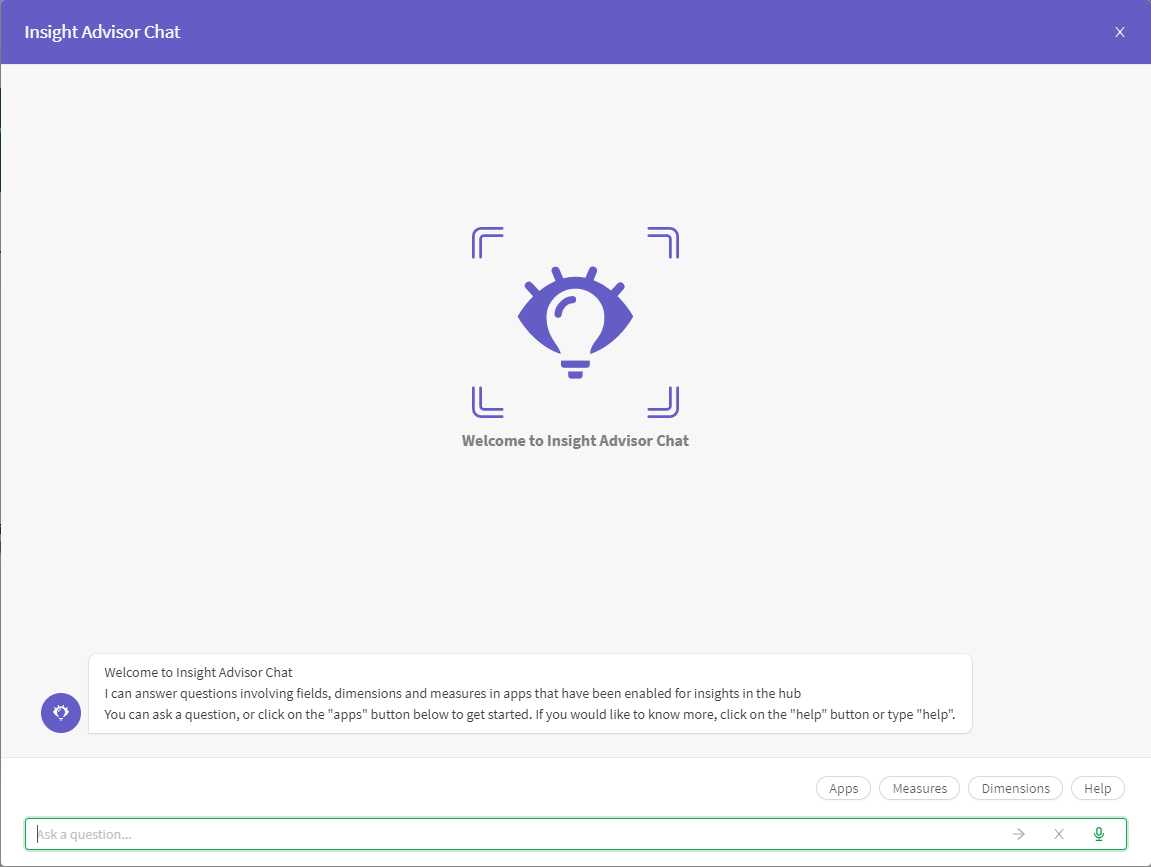
You are greeted with a messaging style interface and you can start typing your natural language queries instantly. You also have some buttons to assist you navigating through the apps, measure, and dimensions, as well as a help option. These buttons are effectively shortcuts to key phrases to help users get into their data.
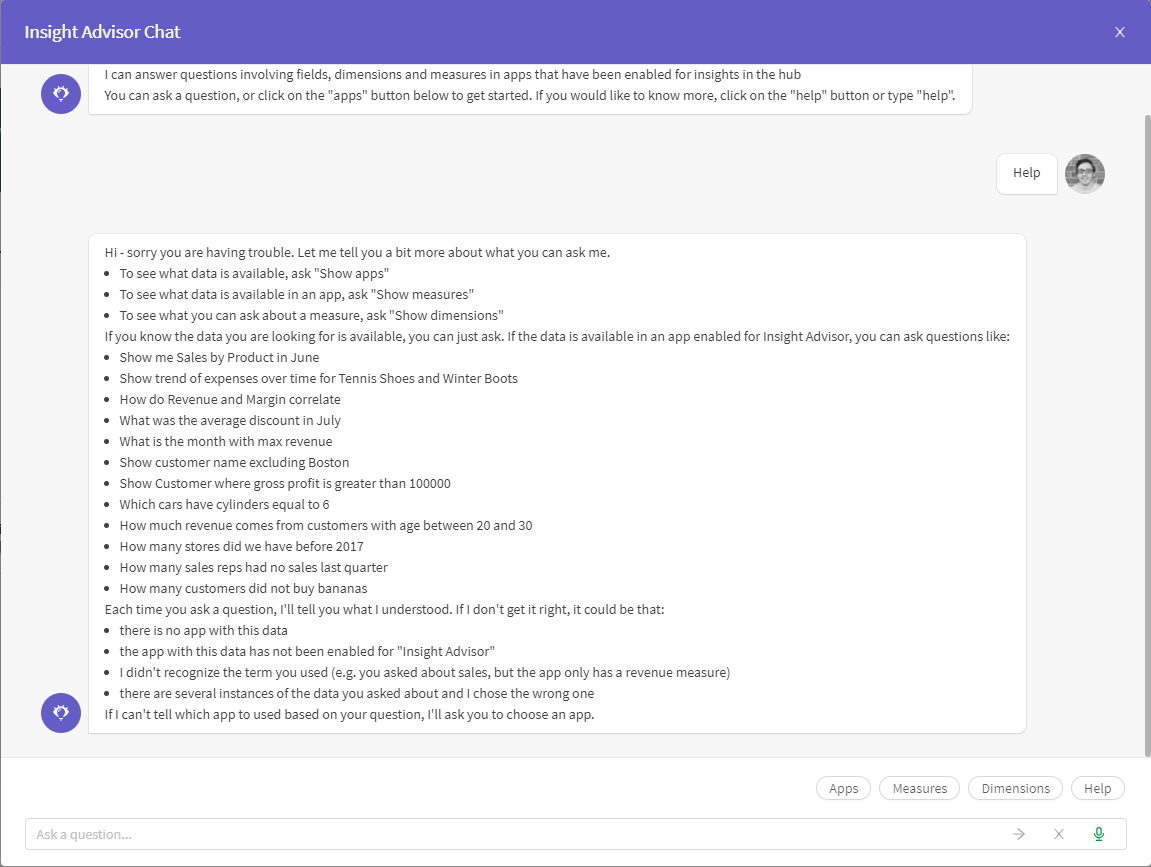
Help, for example, will type help into the chat and Insight Advisor will return a list of example commands you can use:
If we start querying our data, for example typing ‘Show me number of sales’, Qlik will examine the available apps and where it finds a match it will analyse that app. If multiple apps have matches it will prompt the user to select the most appropriate. Rather nicely, Qlik’s Insight Advisor not only presents your question back to you but also breaks down how it has interpreted it. Below we can see it has found ‘Number of sales’ as a master measure. In addition, you can see the Insight advisor has also opened the app that we are analysing:
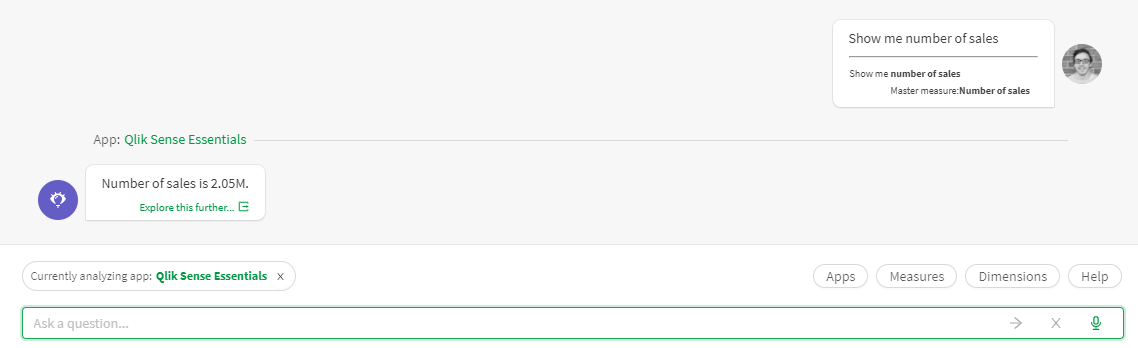
We can expand on this further..
To extend the question, the ‘up’ arrow on your keyboard acts as a very handy hot key to populate the input box with the previous questions you’ve asked. We can ask things like:
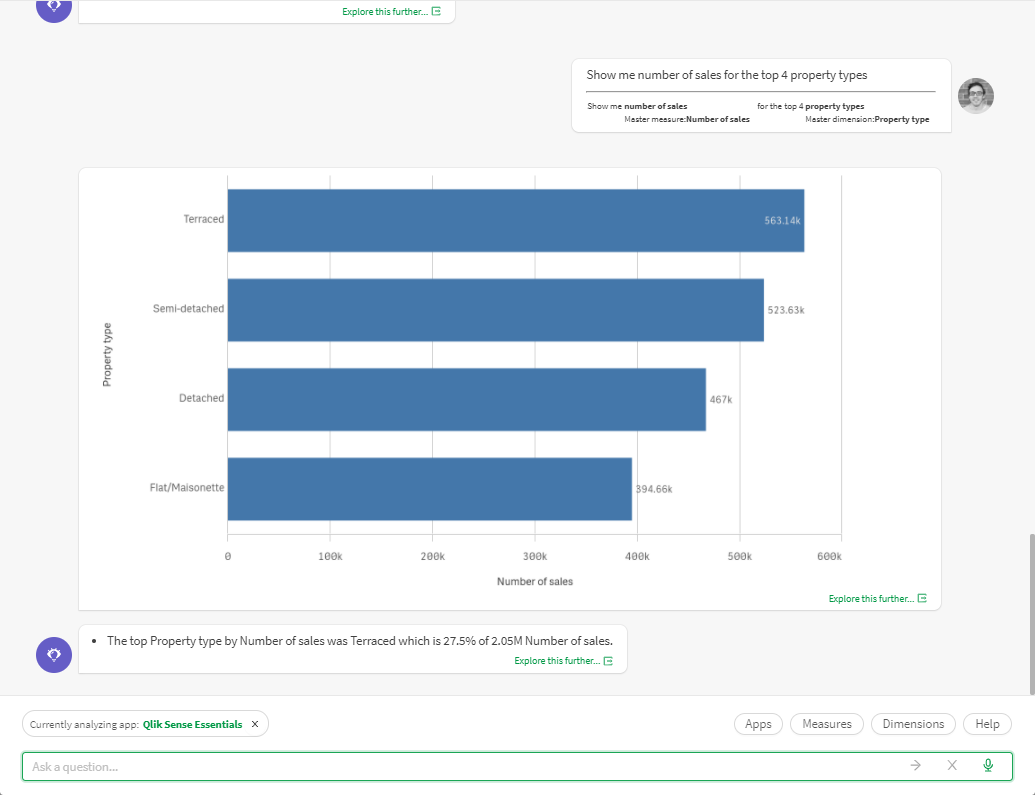
- Show me number of sales for the top 4 property types
- Show me number of sales for Detached properties
- Show me number of sales for Detached properties in 2016
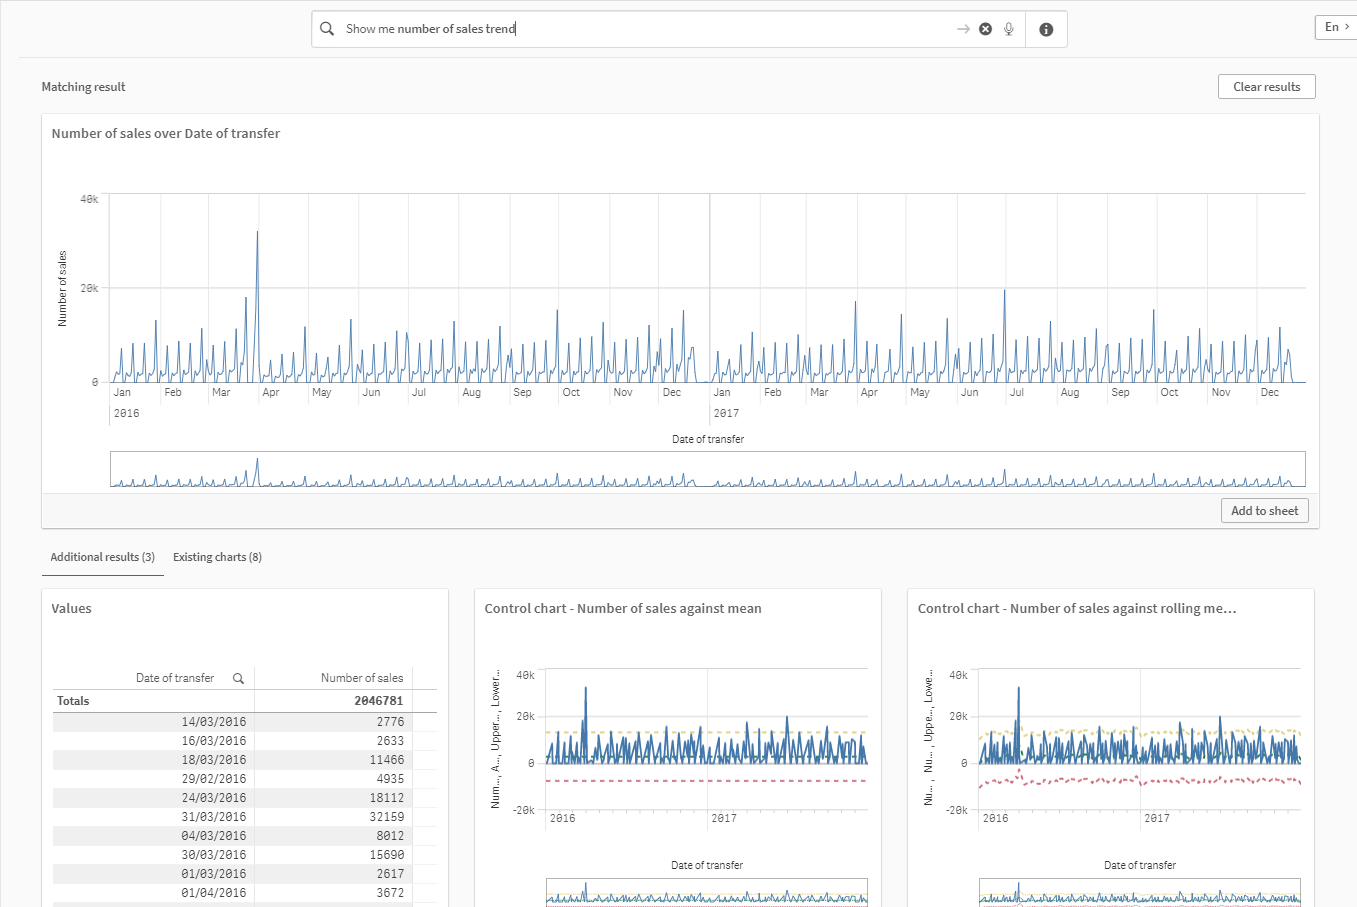
- Show me number of sales trend
See the video at the start of the post for example question and answers. Once you’ve found something interesting, you can explore it further by clicking the link under the response. This will take you into the app that provided the response, opens the Insights Advisor view and populates with the question it answered – quick and seamless.
Although Qlik does a brilliant job of inferring the logical model, and it really does work well from my limited experience, you may want to spend some time further configuring the app for natural language querying. By further configuring the logical model, you will educate the chat bot with richer and deeper understanding of what fields you are interested in, what they contain, and how they should be used together (if at all), this will ensure the Insights Advisor Chat provides more meaningful answers.
Logical model
There is a new view to be aware of in the September 2020 release, the Logical model, under Business logic, in the Prepare tab.
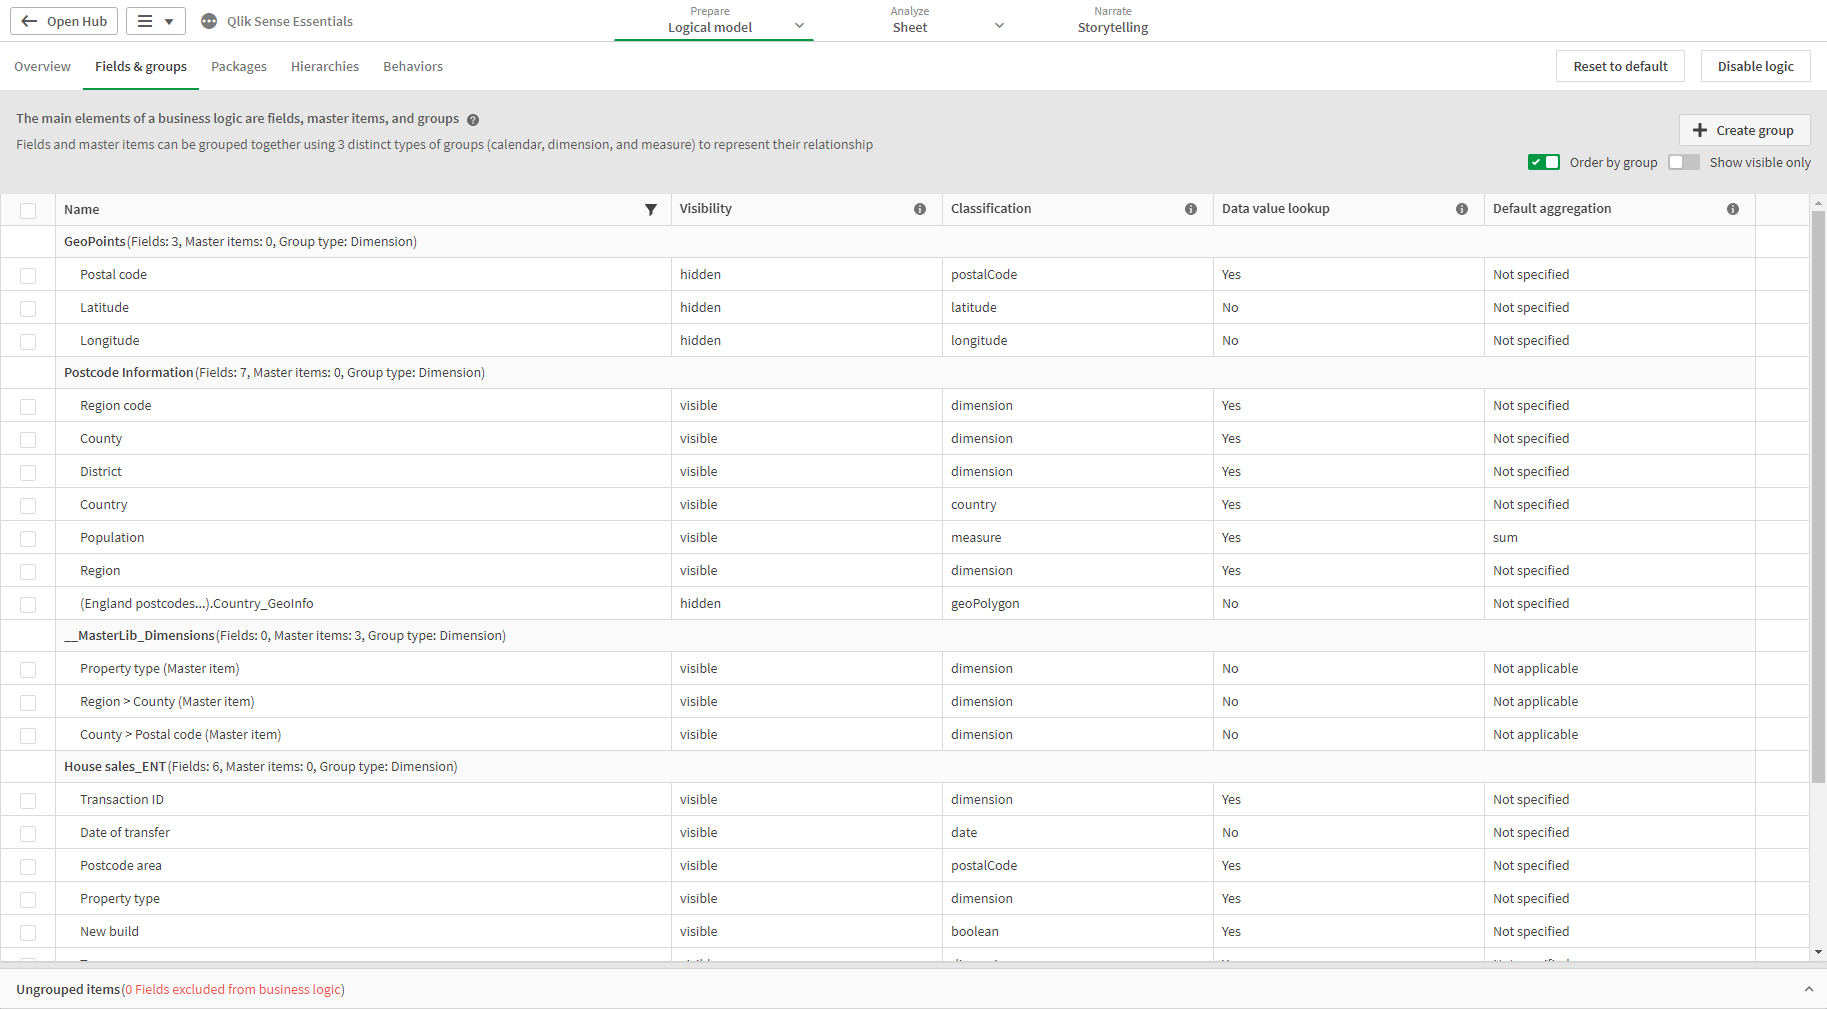
In this view we can configure fields & groups, packages, hierarchies and behaviours. From the Overview tab in the screenshot below, Qlik Sense has automatically configured a lot of this for us:
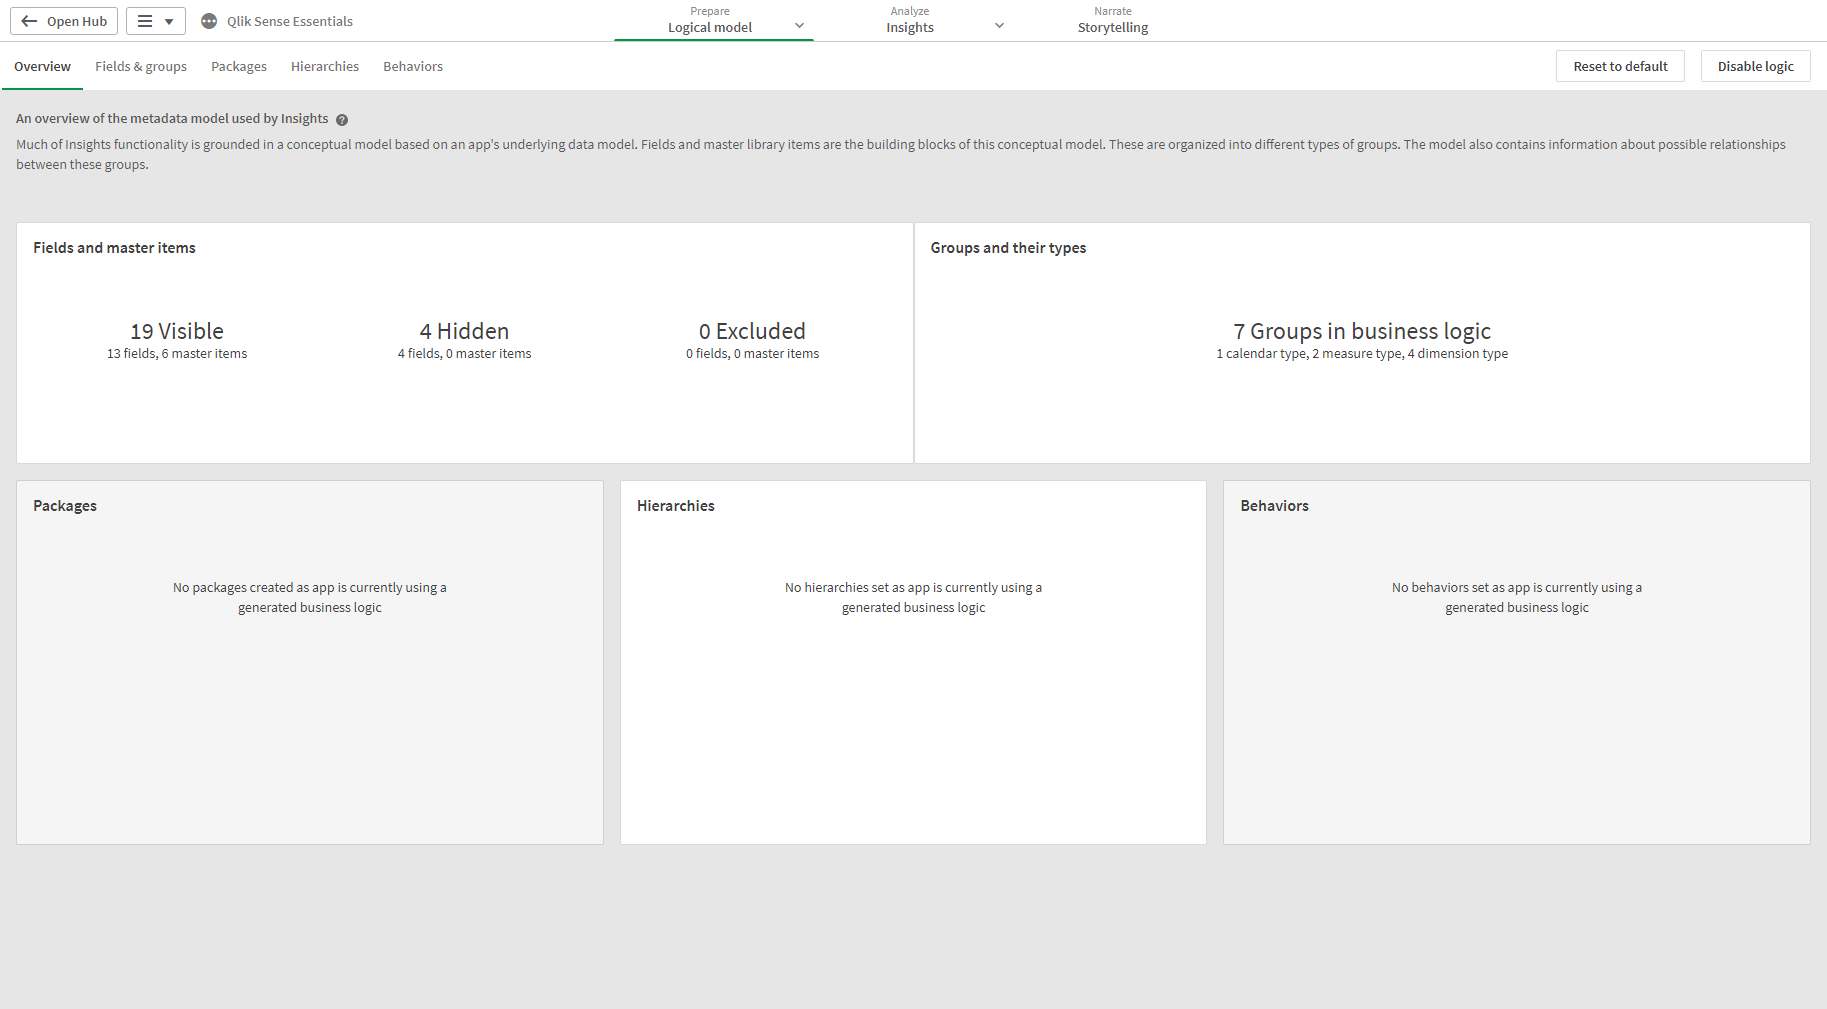
As it states at the top of the page, Qlik derives the initial logical model from the app’s underlying data model, fields and master library items. These things combine to provide the foundation which Qlik users can build upon to further refine and complement to provide more tailored insights.
The logical model of an app is the conceptual model that directly influences what insights are generated. For example, when a user asks “Show me number of sales over time”, Insights Advisor will try to find a date field that is part of the primary calendar group, as well as try to present the results as a trend graphically:
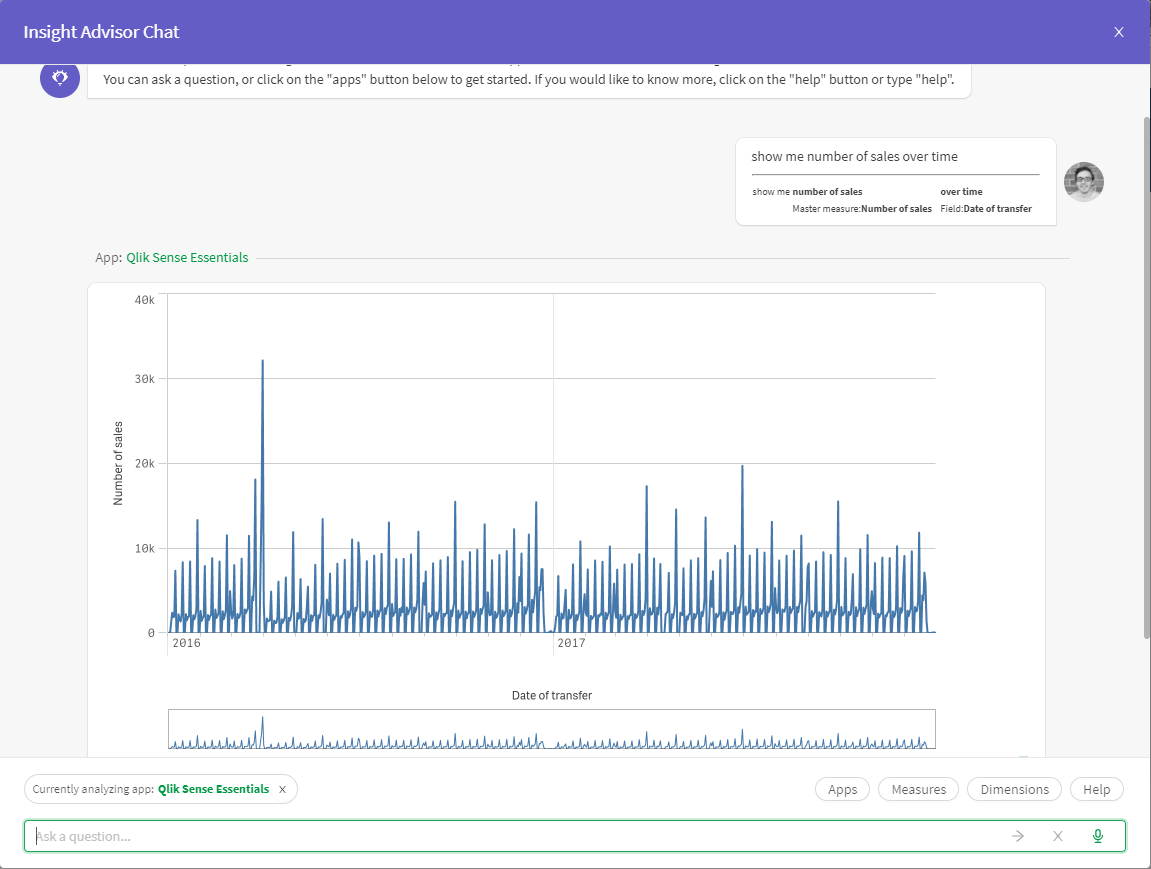
Notice it has married ‘number of sales’ with the Master measure ‘Number of sales’ and ‘over time’ with the date field ‘Date of transfer’. Since moving to Qlik Sense, I’ve consistently spoken out about using intuitive and descriptive names for fields and master items. Well, this will force you to if you don’t already.
We’ll look into the four components that form the logical model below.
Fields & Groups
Fields & Groups form the primary component of the logical model. It consists of all the fields, master dimensions and master measures in the application. These fields and master items can be grouped and their business logic defined in this view:
Groups
In the example above, Qlik has automatically grouped each field and master item. The group name appears as the sub-section header. Groups enable Qlik Sense users to organise related fields together – it is likely you’ll group your dimensional table fields together. For example, all fields related to products should be grouped together – Product name, Product number, Product Description, Product group, etc. It’s worth noting, you can group fields regardless of the internal table they belong to.
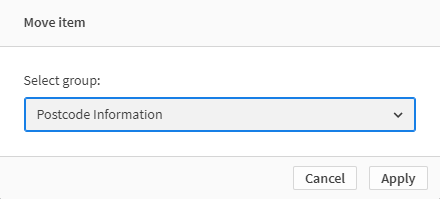
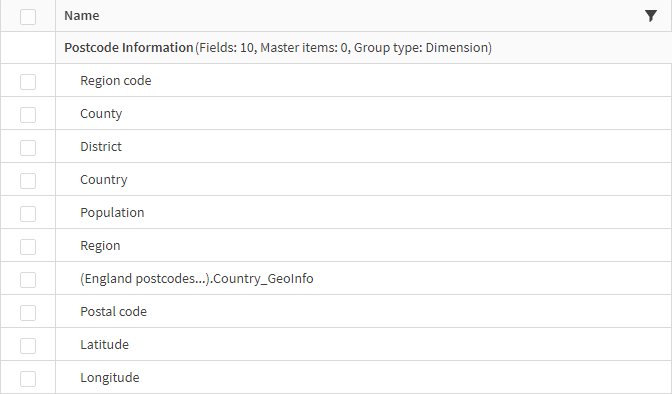
We can combine groups using the Move item options. This can be completed at an individual field level or using the bulk selection check boxes on the left. Once selected, click Move item and select the group to move them to:
Here I’ve combined all the geospatial fields into a single grouping:
When creating new groups, you’ll need to specify what type of group it is:
- Dimension: A dimension group typically consists of fields that are classified as dimensions. However, they can also contain fields classified as measures or dates.
- Measure: A measure group solely consists of related measure fields. Only measures can belong to a measure group.
- Calendar: A calendar group contains a time dimension in your logical model. These can only contain dimensions and are expected to have at least one temporal field (such as date, timestamp, or year). Calendar groups are useful if you have dedicated calendar fields, in addition to a derived time-aware calendar, such as year, month, and day. You can also group other data-related fields, such as financial quarter or financial year.
In addition to the Groups, Qlik users can control the visibility, classification, data value lookup and default aggregation of each field/master item.
Visibility
The visibility concerns whether a particular field/master item is available to the Insight Advisor Chat to see and reference. When hiding fields, you should also disable the Data value lookup option. Once you’ve hidden all unnecessary fields, there is a handy switch in the top-right of the view to only show visible fields. Common fields you’ll want to hide are ID/concatenated fields that are created solely for data modelling purposes, certain geospatial fields and you may also wish to hide numeric fields specified in master measures due to it not including the necessary business logic the master item expression contains.
Classification
Classification defines the default role that attribute can play in your analysis. For example, specifying a field as a monetary value will result in any aggregations it returns for that field being represented as such, or choosing the Date classification will mean it will use that field for trend analysis, etc. In total, there are 28 classifications which can be grouped as Dimension, Measures or Calendar/Temporal:
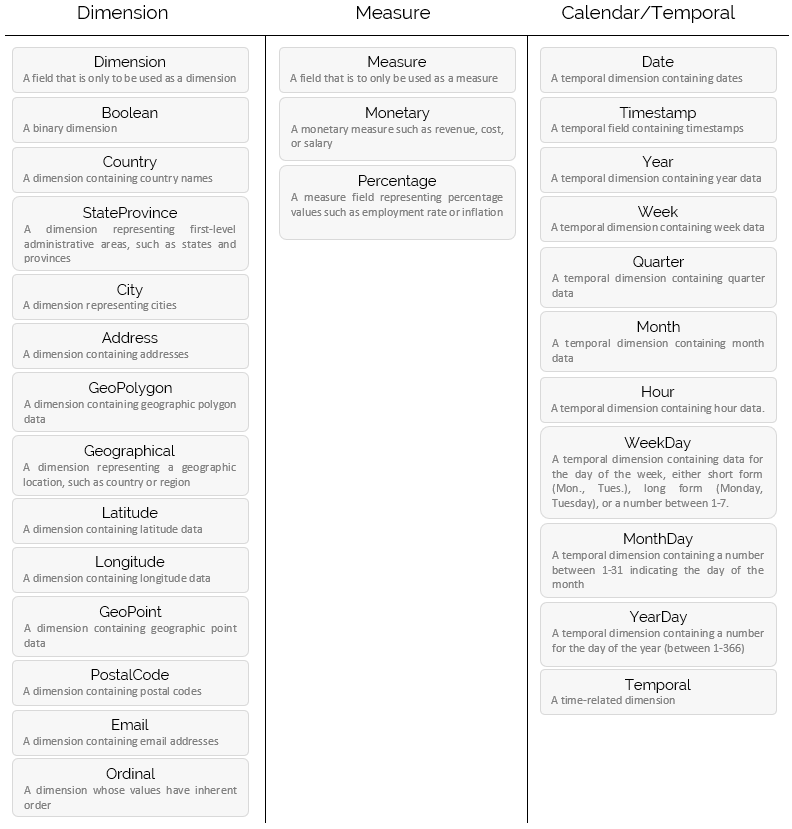
In some cases, you may want to use a field for multiple use-cases, therefore it is best practice to create a master item for each use-case and classify them accordingly.
Data value lookup
Data value lookup controls whether or not the Insights Advisor can lookup values from the fields when performing a query. It is said to be best practice to reduce the number of fields with this turned on to optimise performance and reduce false positive results. At the vert least, this should be disabled for measures and hidden fields.
Default aggregation
When a field has a default aggregation, Insights Advisor will always apply that aggregation when using it as a measure. Users can edit insight charts to change the aggregation to a different type. Users can also prefix the field name with an aggregation and it will override the default aggregation which is really handy. It’s worth noting that default aggregations cannot be assigned to master items.
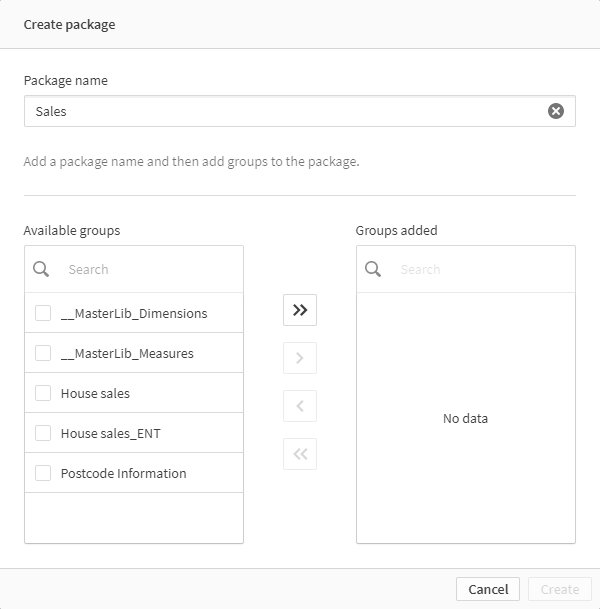
Packages
Packages are a collection of groups. This enables Qlik users to define the scope for one or more groups of fields. This is useful if your data model contains multiple data sets from largely unrelated business areas. This effectively provides a mechanism for adding context to your groups, and removing the possibility of irrelevant results.
Packages are optional, and are only needed for the aforementioned use-case. If no packages are defined then Qlik sees all fields and groups as a single package.
Creating a package is as simple as defining a name and selecting the groups:
This is a further example where you may need to create duplicate fields/master items that can form part of multiple groups and packages.
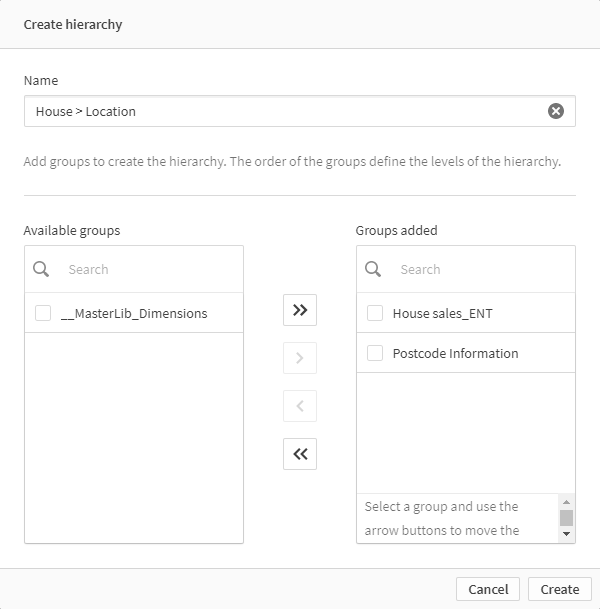
Hierarchies
Hierarchies, like packages, are useful for adding context and restricting the scope of the Insight Advisor Chat. Hierarchies specifically impact recommendations on how metrics are broken down and the drill-down path through your data. The prime example being supplier and customer. If you are analysing sales by supplier, selecting a supplier country, you don’t want the Insight Advisor to then show Customer city as the next level, you want it to show the supplier city – Supplier information being the context of that particular analysis.
From my initial investigations, if in the event you have multiple similar hierarchies present in your data model such as Supplier location and Customer location then it appears you want to create a hierarchy for each Measure and dimension group pairing. For example, one hierarchy for Measure group + Supplier group and another hierarchy for Measure group + Customer group.
Creating a hierarchy is also as simple as defining a name and selecting the groups:
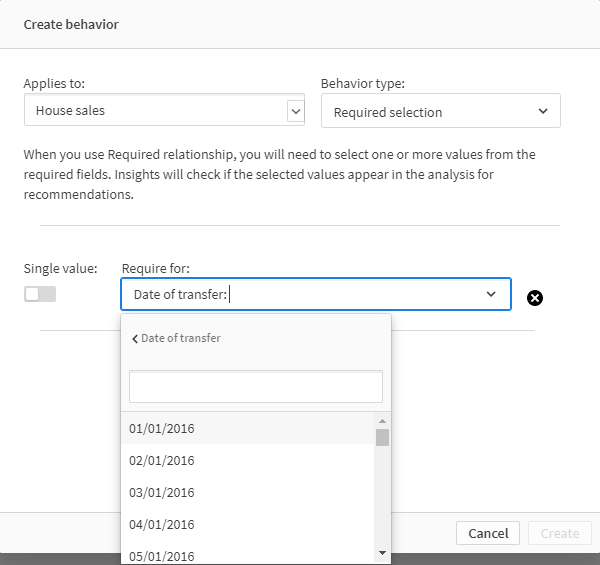
Behaviours
Put simply, behaviours guide the Insights Advisor further by pairing and separating groups. There are three types of behaviours:
Prefer relationships: Create collections of groups, resulting in the Insight Advisor prioritising the combination of fields/master items from those groups in its answers.
Deny relationships: Inform Insights Advisor which groups do not and should not mix together. This avoids irrelevant responses.
Required selections: Limit the scope of the data returned by enforcing a selection on a field. For example, when someone asks for Sales by product, you could impose a required selection on the group containing the measure and require a selection of the Year field, and default to the current year. The only downside I can see here is that expressions and wildcards can’t currently be used, which may put users off using this particular behaviour for date fields.
Insight Advisor Chat: Summary
The Insight Advisor Chat is one of the reasons we at Ometis have transitioned into Qlik SaaS advocates in recent weeks. As the Insight Advisor Chat is bundled into your SaaS subscription for no additional charge, you get more value for money. The integration and implementation of this feature is brilliantly executed and, importantly, it’s intuitive and responsive. This feature will reduce time to insights and the technical skills to navigate data and the platform it resides within.
There are clearly further capabilities to make it even more accessible, such as integration with collaboration tools such as Slack and Microsoft Teams, which Qlik Insight Bot has. I suspect these will be on the roadmap and then users at the edges of the business can query data from their natural habitats, and that would be really powerful. Another item on my wish list is further expansion of phrases, with the ability to ask more detailed ‘not’ and ‘exception’ questions – something Qlik Sense itself is really strong at answering but I couldn’t seem to get this to work in my initial tests. For example:
- Show me number of sales for all properties except Other
- Which counties did not have detached sales in 2017
By Chris Lofthouse #QlikLuminary
Follow @clofthouse89


Comments