

Qlik Sense November 2019 is out and as always our man Chris Lofthouse has taken a close look at the new features and functionality.
To quote GoT (Game of Thrones), “winter is coming”. Unlike winter though, Qlik Sense November 2019 is already here and we have a solid release to round out an excellent year for Qlik Sense. Let’s start off with my two favourite additions to Qlik Sense November 2019; a new native visualisation and some rather impressive accumulation action.
Qlik Sense November 2019 Release
Mekko Chart
The Mekko chart arrives in Qlik Sense at last, closing off more gap functionality to QlikView. A Mekko chart is useful for identifying large segments between two dimensions. The Mekko charts displays a varying height and width of each bar, with each axis totalling 100%. Not to be confused with a 100% stacked bar chart which only has a varying height. See a quick example below:
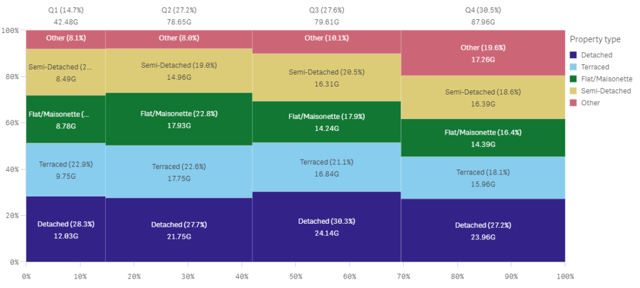
When using the Mekko chart just be careful with the sort order, typically you’ll want to prioritise the sort of the secondary dimension over the measure, otherwise it can make the object difficult to interpret.
Native Accumulation Option
Limited to the Bar chart, Line chart, Combo chart, and Table, Qlik Sense now offers the ability to quickly accumulate over a dimension, requiring no knowledge of Qlik’s expression language. This is another one of those small, yet impactful and exciting additions to accelerate a business user’s ability to create advanced dashboards with little technical on-boarding.
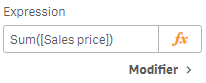
Here are my tips on using the accumulation option. Firstly, this doesn’t appear to work with chart suggestions enabled. Therefore, disable the chart assistance in the property menu of the visualisation and then you should see the modifier option beneath the expression input box:
This will expand the section to reveal a drop-down box, where you can select Accumulation:
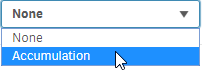
Since it’s a drop-down with one option, it’s probably safe to assume that further options will appear here at some point in the future.
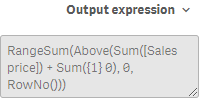
We can also further customise the functionality, controlling things like whether to show excluded values and the range; either selecting to accumulate fully over a dimension or within a finite number of steps. Annoyingly, the default options Qlik have opted for are to have the range set to ‘Custom’ with six steps and ‘Show excluded values’ ticked, which personally I find the opposite to fulfil 80% of what I do. For example, my preference would be for Show excluded values unticked and Range set to full. Lastly, you can view the output expression towards the bottom of the section:
UPDATE: Patrik Lundblad has kindly pointed out to me an additional option when using the accumulation on a stacked bar chart – the ability to chose which dimension/s to accumulate over. The user has the ability to select a single dimension or across all dimension. It’s nice to see this has been thought of.
Below, I’ve included four examples with different options selected:
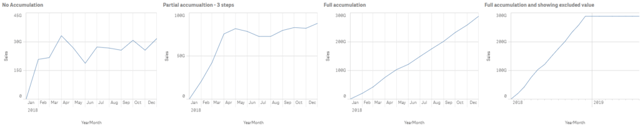
This is a great addition and I know I’ll be using this a lot in the future. Let’s now focus some more of the minor improvements.
Exclude map layers from auto-zoom
For Qlik Sense customers using the map object, particularly those using background layers, you now have the ability to control the auto-zoom functionality at a layer level. This provides users with a more predictable and frankly less ‘jumpy’ experience than before – as the default behaviour is to zoom out, so every layer is visible. Previously, this resulted in the map potentially fully zooming out when it wasn’t desired. A couple of our customers will certainly benefit from this improved UX (user experience).
Table styling
Continuing to provide more advanced authoring options for Qlik Sense developers, the table object is the latest visualisation to receive styling capabilities. The table object can now style:
– Header font size and colour
– Cell font size and colour
– Centre align columns
Qlik have noted that further styling options are to set arrive in the future too. However, please remember with great control comes great responsibility and to keep in tune with showing the art of the disastrous, here is what is possible with just a few clicks:
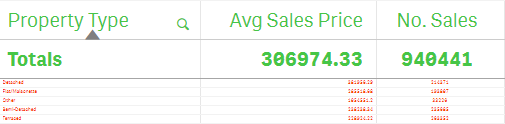
I understand that Qlik have come under fire in the past and present, mostly from dedicated QlikView developers, for the lack of granular control over styling options, but I wasn’t one of them and whilst I’m not against these styling options, removing the barriers previously in place to ensure best-practice design seems like a step backwards. Qlik Sense isn’t and, in this regard, should never become QlikView. I feel these options should be present but in a more controlled implementation, ideally with an advanced option for those who truly demand it.
Trellis container improvements
As well as improving the native objects, Qlik has made an improvement to the Trellis container, which was released in Qlik Sense June 2019 as part of the visualisation bundle:
– Extended to two dimensions, previously it was restricted to one.
– Border width and colour options, enabling Qlik Sense developers to highlight the individual trellis charts.
– Support for calculated dimensions, which make it easier to limit the number of charts rendered.
– Extended advanced mode support, to enable trellising of more complex charts.
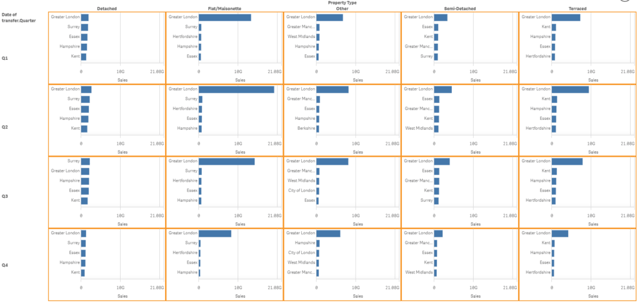
A quick tip from me, if you see a message that says ‘too many dimensional values’ then you either need to reduce the number of dimensional values, e.g. using a calculated dimension, or increase the maximum number of charts to render under Appearance > Trellis options.
Qlik Sense Mobile for Android with offline capabilities
With Qlik Sense Mobile November 2019 you can now download Sense apps for offline use on Android devices, as you could already with IOS.
Qlik Sense November 2019 Summary
In the Qlik Sense November 2019 release there has been some very welcomed functionality, mainly in the form of the accumulation option when building expressions, the new native visualisation (Mekko chart) and Qlik Sense Mobile offline capabilities for Android. With Qlik Sense November 2019 being the last release of the year, it’s hard not to reflect on what’s been introduced throughout 2019. Here is a list of my top ten additions that were introduced earlier this year, in no particular order:
- Master item promotion (September 2019)
- Variance waterfall chart (September 2019)
- Copy cell value to clipboard (June 2019)
- Native container visualisation (June 2019)
- Grid layout for mobile devices (June 2019)
- Embed chart option (April 2019)
- Qlik’s Associative Insights (April 2019)
- Single page application flow (February 2019)
- Dollar-sign expansion preview (February 2019)
- Dashboard bundle (February 2019)
The great thing is that there was a lot of new functionality to choose from this year, and even more improvements. It’s great to see the roadmap Qlik presented us towards the end of last year become a reality and it cements our confidence in Qlik delivering on the upcoming items on their most recent roadmap. It’s clear Qlik are keen to stay ahead of the competition, with no sign of slowing down on their commitment of 5 releases per year.
As always, we’re keen to hear your thoughts on Qlik Sense November 2019. Please share, like and comment on the post or through LinkedIn, Twitter and/or YouTube.
By Chris Lofthouse
Follow @clofthouse89


Comments